

August 31, 2016

August 31, 2016
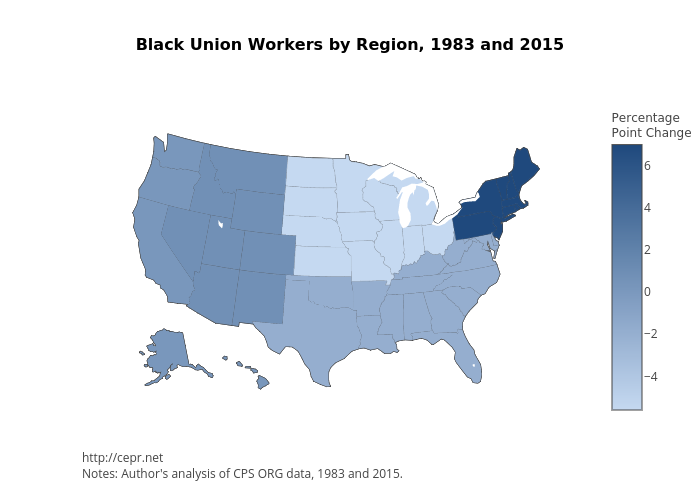
A recent paper by Cherrie Bucknor looks at Census Bureau data to examine the trends in unionization for Black workers. The paper compares Black workers as a share of union workforce across several categories, including region, in 1983 and 2015. The map below shows the five regions of the United States – south, northeast, midwest, pacific and west – and the percentage point change in Black workers in a union from 1983 to 2015. Black workers in the northeast, west and pacific regions are now much more likely to be unionized than those in the south or midwest, where the share of Black workers in a union has dropped 2.0 and 5.7 percentage points respectively.
Read the entire report here.

