

July 20, 2022


July is Disability Pride Month and July 26, 2022 is the 32nd anniversary of the signing of the Americans with Disabilities Act. There are at least 61 million, or more than one-in-four, US adults with disabilities, yet economic policy conversations too rarely include a disability lens.
This chartbook provides tables and figures on the current state of disability economic justice, including disability prevalence, disparities in employment and earnings, and disparities in income poverty and material hardship.
For additional information on disability economic justice, see Economic Justice is Disability Justice, a report co-authored by The Century Foundation and CEPR.
Disability is a complex, multidimensional, and evolving concept, with varying definitions used in different contexts. Depending on the survey and the questions asked, the percentage of adults with a disability varies. In the table below, the middle-ground estimate is that just over one-in-four (25.7 percent) of adults—about 61 million adults—have one or more disabilities.
| Survey and Disability Question Set Used from Most to Least Restrictive | |||||
|---|---|---|---|---|---|
| National Health Interview Survey (NHIS-1) | American Community Survey (ACS) | NHIS-2 | Behavioral Risk Factor Surveillance System (BRSFF) | NHIS-3 | |
| Any Disability | 9.2% | 15.2% | 16.3% | 25.7% | 39.4% |
| Vision | 1.8% | 2.6% | 3.4% | 4.6% | 15.3% |
| Hearing | 1.8% | 3.8% | 5.6% | 5.9% | 16.3% |
| Ambulation | 5.6% | 7.3% | 9.3% | 13.7% | 16.7% |
| Cognition | 2.0% | 5.4% | 5.3% | 10.8% | 15.5% |
| Self-care | 0.9% | 2.8% | 2.6% | 3.7% | 3.5% |
| Independent Living | n/a | 5.7% | n/a | 6.8% | n/a |
| Survey Year(s) | 2010, 2013-2015 | 2019 | 2010, 2013-2015 | 2016 | 2010, 2013-2015 |
Sources: 1) NHIS estimates from https://www.sciencedirect.com/science/article/abs/pii/S1936657418301833; 2) ACS estimates calculated from 2019 ACS Table S1810 at https://data.census.gov/cedsci/table?q=disability%20characteristics&tid=ACSST5Y2020.S1810; 3) BRSFF estimates from https://www.cdc.gov/mmwr/volumes/67/wr/mm6732a3.htm?s_cid=mm6732a3_w.
Notes: Estimates in the NHIS(1) and NHIS(3) columns use the Washington Group on Disability Statistics’ “short set” of questions on disability. Estimates in the ACS and BRSFF columns use a somewhat different short set of questions. An adult is classified as disabled in the ACS, BRSFF, NHIS(2) if columns if they answer “yes” to any of the disability questions. An adult is classified as disabled in the NHIS(1) column if they report having a “lot of difficulty” or “cannot do at all”, and in the NHIS(3) column if they give either of these responses or report having “some difficulty”. See Appendix Table for additional detail.
Developmental disabilities are a group of conditions due to an impairment in physical, learning, language, or behavior areas.Just under one-in-five children (17.8 percent) have a developmental disability. The most common developmental disabilities are ADHD (9.6 percent of children) and learning disabilities (7.7 percent).
| Any developmental disability | 17.8% |
| ADHD | 9.6% |
| Learning disability | 7.7% |
| Other developmental delay | 4.1% |
| Autism spectrum disorder | 2.5% |
| Stuttered or stammered | 2.1% |
| Intellectual disability | 1.2% |
| Seizures past 12 months | 0.8% |
| Moderate to profound hearing loss | 0.6% |
| Cerebral palsy | 0.3% |
| Blind or unable to see at all | 0.2% |
Source: National Health Statistics Reports, Number 139, February 19, 2020. https://stacks.cdc.gov/view/cdc/85308
About one-in-five children have a special health care need (SHCN) due to a health condition that lasts 12 months or longer. Boys are somewhat more likely to have special health cares needs than girls (22.1 percent compared to 16.6 percent), and both Black (23.3 percent have a SHCN) and white (20.2 percent) are more likely to have special health care needs than Hispanic (16.8 percent) and Asian children (10.7 percent).
| Percent | Number | |
|---|---|---|
| Total | 19.4% | 14,125,877 |
| Black | 23.3% | 2,257,329 |
| Hispanic | 16.8% | 3,142,843 |
| White | 20.2% | 7,391,774 |
| Asian | 10.7% | 355,287 |
| Other | 21.2% | 978,645 |
| Female | 16.6% | 5,902,070 |
| Male | 22.1% | 8,223,807 |
Source: National Survey of Child Health, https://www.childhealthdata.org/browse/survey/results?q=8520&r=1&g=914 and https://www.childhealthdata.org/browse/survey/results?q=8520&r=1&g=907.
Note: A child is classified as a having a special health care need if the child’s parent or caregiver says that the child has any of the following service needs or limitations due to a health condition that has lasted or is expected to last 12 months or longer: 1) need or use of prescription medication(s), 2) elevated need or use of medical care, mental health, or education services; 3) functional limitation(s) (that limit daily activity); 4) need or use of special therapies (e.g. physical, occupation, or speech therapy); 5) emotional, developmental, or behavioral problem for which treatment or counseling is needed.
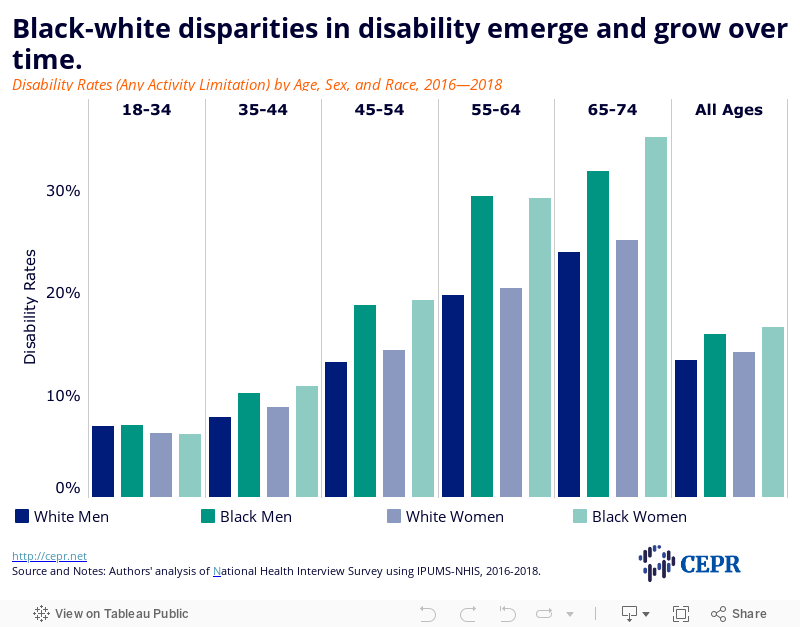
Among young adults (18-to-34-year-olds), disability rates for white women and Black women are roughly the same (just over 6 percent); disability rates for white men and Black men are slightly higher, but also roughly the same (about 7 percent). The likelihood of being disabled increases with age for all four groups. However, the increases are much larger for Black men and women than for white men and women. Nearly 30 percent of Black 55-to-64-year-olds have one or more disabilities compared to about 20 percent of white people in the same age range.
Figure 1
Among the 1.42 million people in state and federal prisons in 2016, just under four-in-ten (38.4 percent) had a disability.
| Prisoners with a Disability | |||
|---|---|---|---|
| Total Prisoners | Number | Percentage | |
| All | 1,421,700 | 545,933 | 38.4% |
| State | 1,248,300 | 495,575 | 39.7% |
| Federal | 173,400 | 49,939 | 28.8% |
Source: Authors’ calculation from the U.S. Survey of Prison Inmates 2016, https://bjs.ojp.gov/library/publications/disabilities-reported-prisoners-survey-prison-inmates-2016
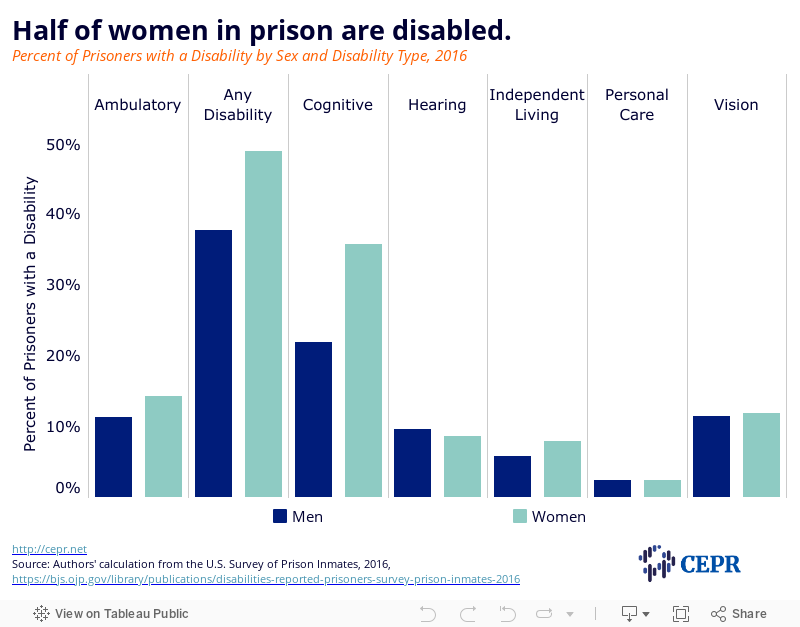
Half of women in prison are disabled compared to just under four-in-ten men in prison. For both men and women in prison, cognitive impairments are the most common disability followed by walking impairments for women and vision impairments for men.
Figure 2
Only about three-in-ten disabled adults are employed compared to three-in-four nondisabled adults. Disabled adults are nearly three times more likely than nondisabled adults to not be in the labor force (neither employed nor actively looking for work). Among disabled adults, those with a hearing or vision impairment (but no other disability) have the highest employment rates, while those with more than one disability have the lowest employment rates.
| Employed | Unemployed | Not in Labor Force | |
|---|---|---|---|
| Not Disabled | 71.3 | 5.0 | 23.6 |
| Disabled (One or More Disabilities) | 30.4 | 4.2 | 65.4 |
| Has One Disability | 41.5 | 5.2 | 53.3 |
| Hearing only | 63.7 | 4.3 | 31.9 |
| Vision only | 55.2 | 5.9 | 38.9 |
| Cognitive only | 39.8 | 7.5 | 52.7 |
| Ambulatory only | 29.9 | 3.7 | 66.4 |
| Independent living only | 22.8 | 4.0 | 73.2 |
| Personal care only | 35.2 | 2.4 | 62.4 |
| Has More than One Disability | 15.2 | 2.8 | 81.9 |
| Hearing difficulty plus | 24.9 | 2.7 | 72.4 |
| Vision difficulty plus | 20.2 | 3.3 | 76.6 |
| Cognitive difficulty plus | 14.9 | 3.2 | 81.9 |
| Ambulatory difficulty plus | 12.7 | 2.2 | 85.1 |
| Independent living difficulty plus | 11.0 | 2.5 | 86.5 |
| Personal care difficulty plus | 9.5 | 1.7 | 88.8 |
Source: Authors’ analysis of Current Population Survey, Basic Monthly Sample, 2020-2021. Includes people ages 16 to 64.
Just over one-in-ten disabled workers are union members. There is little difference in union membership between disabled and nondisabled workers.
| Share of Employed Union Members by Disability | |
|---|---|
| Not Disabled | 10.6% |
| One or More Disabilities | 10.4% |
| Two or More Disabilities | 9.6% |
| Ambulatory only | 12.6% |
| Cognitive only | 8.1% |
| Hearing only | 12.8% |
| Vision only | 7.9% |
Source: Authors’ analysis of Current Population Survey Outgoing Rotation Group, 2020-2021. Includes employed wage and salary workers ages 16-64.
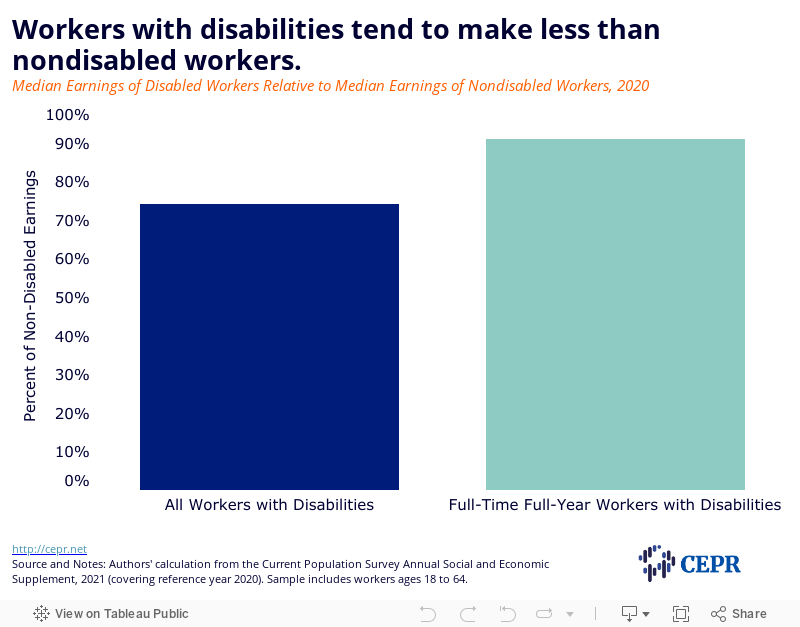
Workers with disabilities are paid less than nondisabled workers. In 2020, disabled workers were paid $0.74 of what nondisabled workers were paid, based on CEPR’s analysis of median wages for full-time workers.
Figure 3
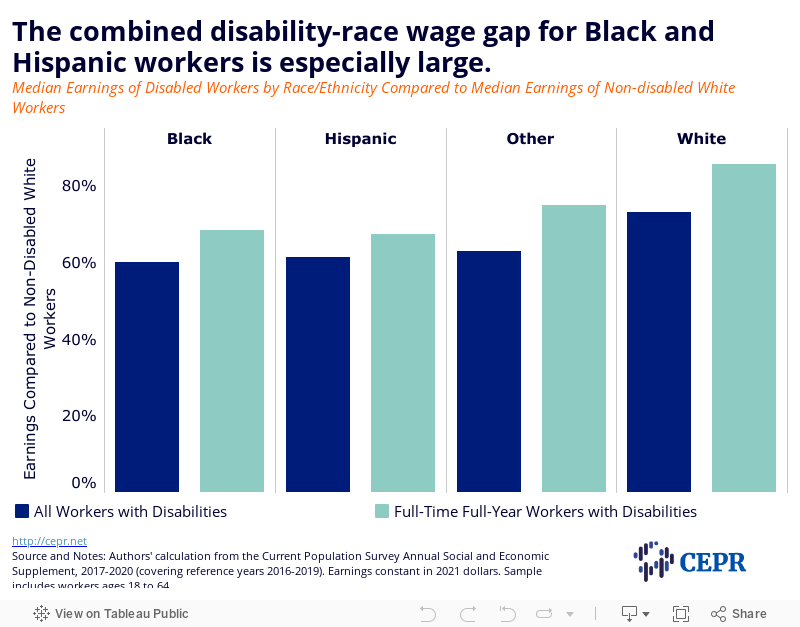
In the late 2010s, disabled white workers were paid 85 percent of nondisabled white workers. Black and Hispanic disabled workers were paid only about two-thirds of what white nondisabled workers were paid.
Figure 4
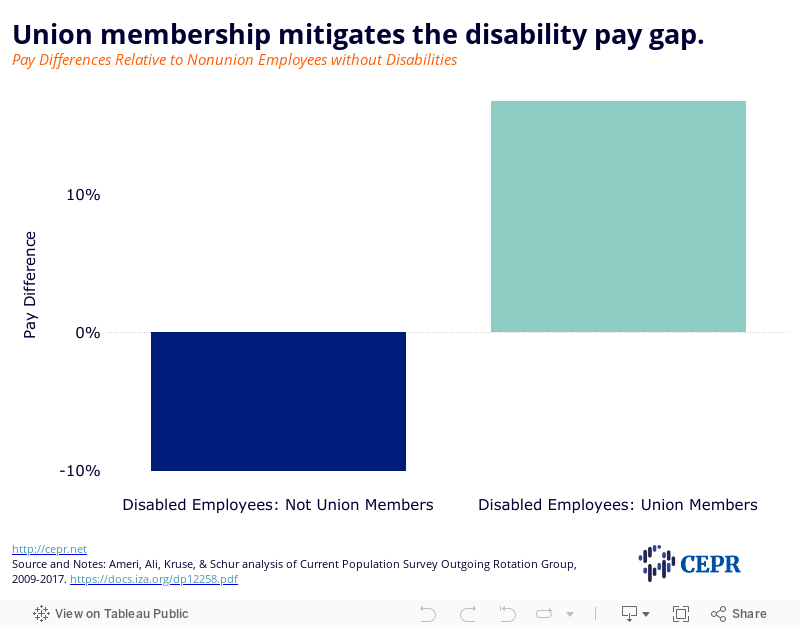
Among nonunion employees, disabled employees are paid 10 percent less than nondisabled employees. Union membership flips that wage gap into a wage premium. Disabled union employees earn about 17 percent more than nondisabled, nonunion employees.
Figure 5
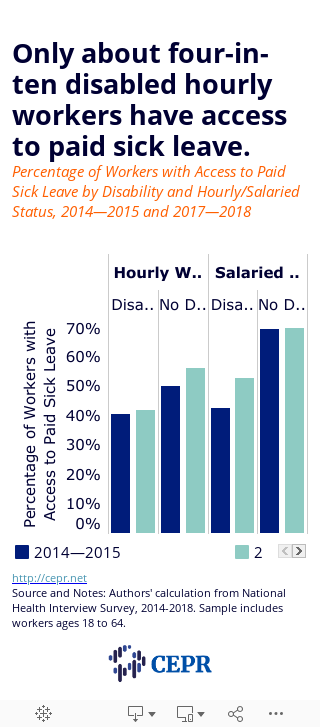
Disabled workers are less likely to have access to paid sick leave than nondisabled. Among hourly workers in 2017–2018, only 42 percent of disabled workers had paid sick leave compared to 56 percent of nondisabled workers. Among salaried workers during this same period, 53 percent of disabled workers had paid sick leave compared to 69 percent of nondisabled workers. The share of disabled workers with access to paid sick leave increased somewhat during the 2010s, especially among salaried workers.
Figure 6
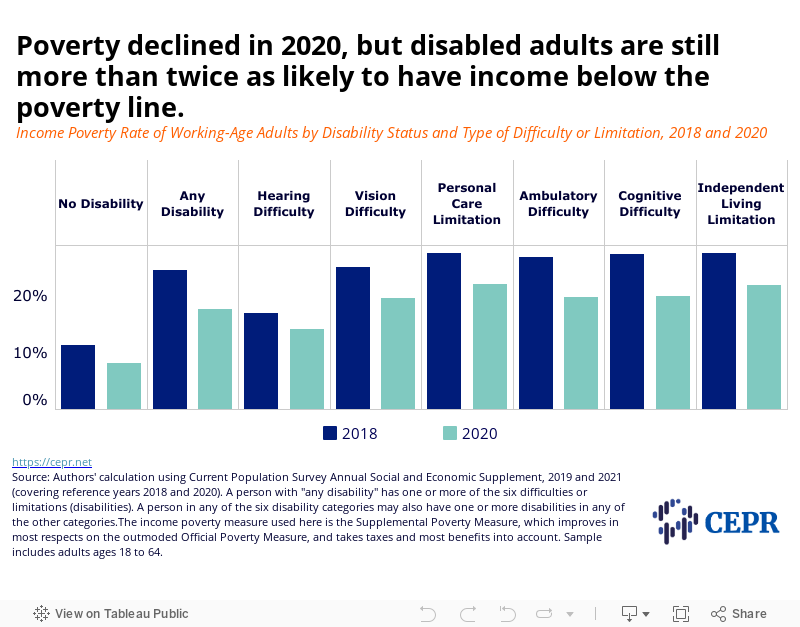
Disabled adults are twice as likely as nondisabled adults to have income below the poverty line. Among adults with disabilities, those with hearing difficulties have the lowest poverty rate (14.1 percent in 2020), while those with personal care limitations have the highest poverty rate (22.1 percent). The poverty rate for both disabled and nondisabled adults declined considerably between 2018 and 2020, largely due to temporary benefits provided by COVID-19 relief legislation.
Figure 7
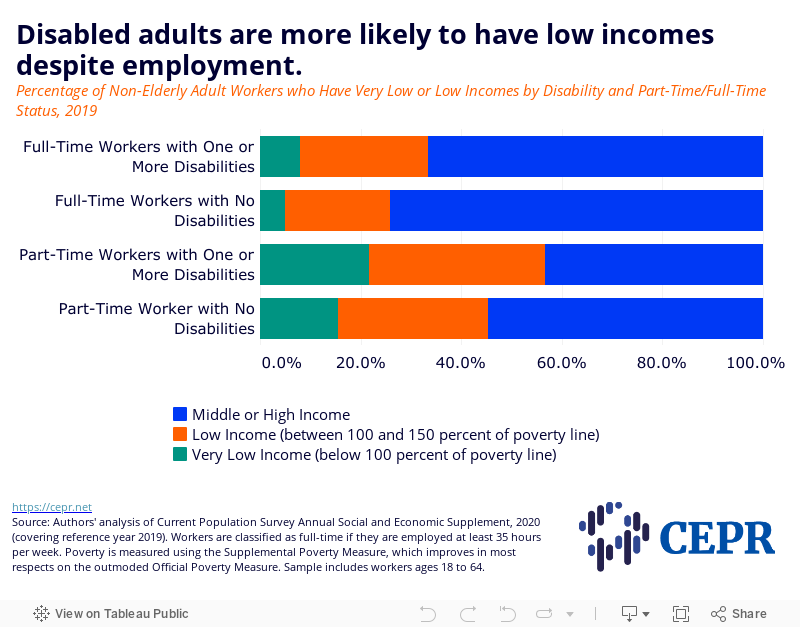
Among full-time workers, workers with disabilities are more likely to live in low-income households than nondisabled workers (33.4 percent vs. 26 percent). The same pattern holds for part-time workers.
Figure 8
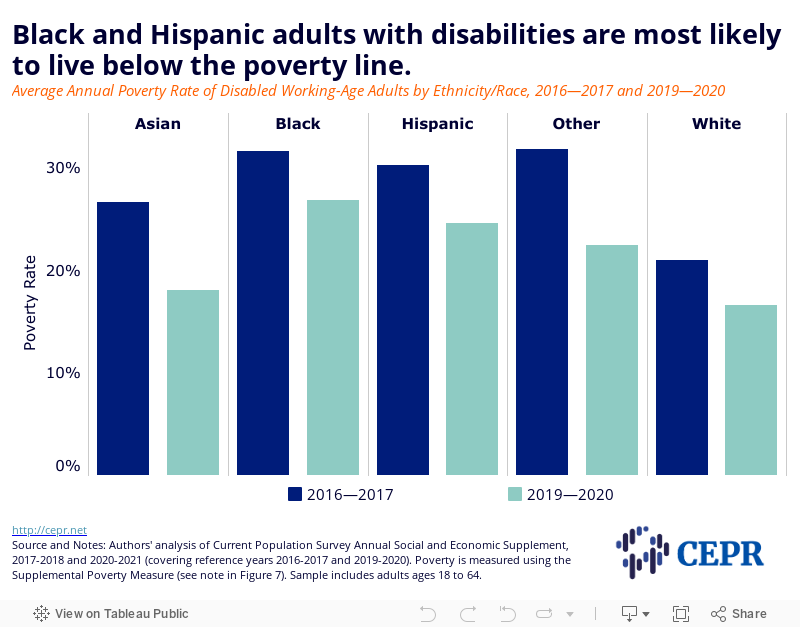
Among non-elderly disabled adults, Black disabled adults have the highest poverty rate (26.8 percent in 2019-2020) followed by Hispanics (24.6 percent), Asians (18.1 percent), and whites (16.6 percent).
Figure 9
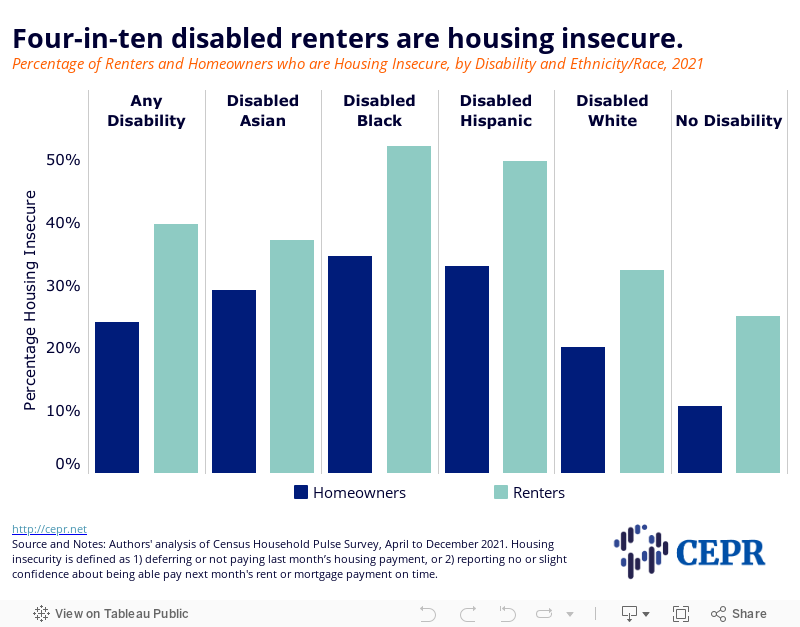
In 2021, four-in-ten disabled renters and one-in-four disabled homeowners were housing insecure, compared to one-in-four nondisabled renters and roughly one-in-ten nondisabled homeowners. Among disabled renters and homeowners, Black and Hispanic renters had the highest housing insecurity rates; about one-in-two renters and one-in-three homeowners in these groups were housing insecure.
Figure 10
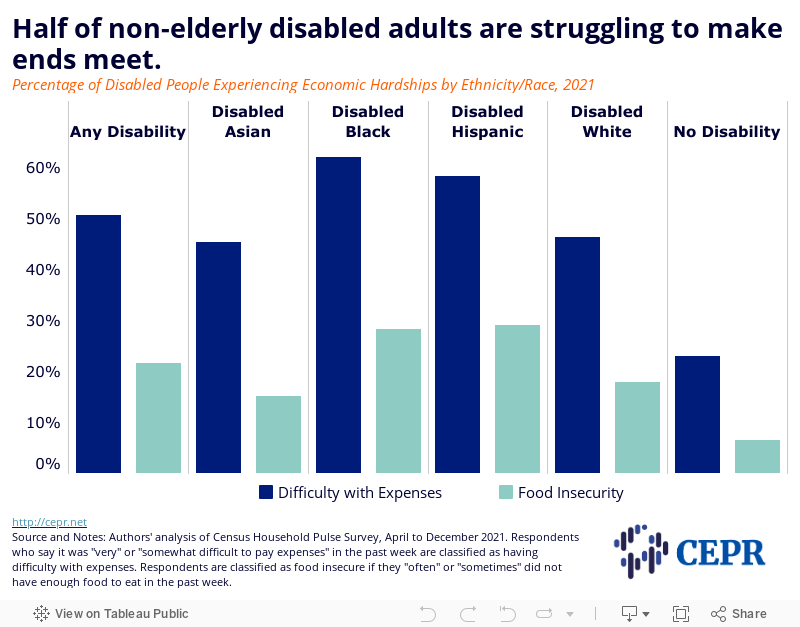
In 2021, disabled adults were more than twice as likely than nondisabled adults to say it was “very” or “somewhat difficult” to pay expenses, and more than three times as likely to report “often” or “sometimes” not having enough to eat.
Figure 11
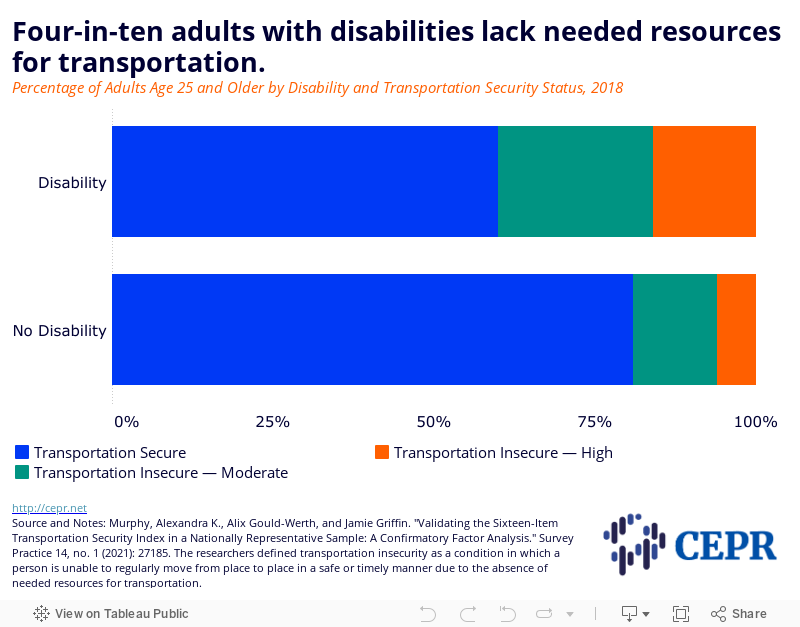
According to a new 16-item transportation security index, about four-in-ten disabled adults experience transportation insecurity, meaning they are unable to regularly move from place to place in a safe or timely manner due to the absence of needed resources for transportation. By comparison, only about one-in-five nondisabled adults are transportation insecure.
Figure 12
| HHS Standard Short Set | Washington Group on Disability Statistics Short Set | |
|---|---|---|
| Hearing | Are you deaf or do you have serious difficulty hearing? | Do you have difficulty hearing, even if using a hearing aid? |
| Vision | Are you blind or do you have serious difficulty seeing, even when wearing glasses? |
Do you have difficulty seeing, even if wearing glasses? |
| Cognition | Because of a physical, mental, or emotional condition, do you have serious difficulty concentrating, remembering, or making decisions? |
Do you have difficulty remembering or concentrating? |
| Mobility | Do you have serious difficulty walking or climbing stairs? | Do you have difficulty walking or climbing stairs? |
| Personal Care | Do you have difficulty dressing or bathing? | Do you have difficulty (with self-care such as) washing all over or dressing? |
| Independent Living | Because of a physical, mental, or emotional condition, do you have difficulty doing errands alone such as visiting a doctor’s office or shopping? | |
| Communication | Using your usual (customary) language, do you have difficulty communicating, (for example understanding or being understood by others)? | |
| Allowable Responses | yes/no | “some difficulty”, “a lot of difficulty”, or “cannot do at all” |
| Used In | ACS, BRFSS (2016-2019), CPS, NHIS (2008-2017). For more complete list, see Disability and Health – Disability Data | CDC. | NHIS and censuses and surveys in over 75 other countries. See The Washington Group on Disability Statistics. |
