

January 25, 2013


On January 23, the Bureau of Labor Statistics (BLS) released its estimates for union membership in the United States in 2012. This post focuses on the union membership numbers by state. In addition to presenting the BLS estimates for overall union membership in each state, we also provide our own breakdown of state union membership in the private and public sector.
Both the BLS and our own estimates are drawn from the Current Population Survey (CPS).* To give a picture of short-term trends, we present union membership data for both 2011 and 2012.
Table 1 shows total union membership in each of the 50 states and the District of Columbia in 2011 and 2012, based on the BLS data. The last row of the table shows the same information for the nation as a whole. The first three columns present data on the total number of union members. The last three columns display the data as a share of wage and salary workers (that is, excluding the self-employed).
In 2012, California (2.5 million union members), New York (1.8 million), and Illinois (0.8 million) had the most union members. New York (23.2 percent of employees), Alaska (22.4 percent), and Hawaii (21.6 percent) had the highest unionization rates. North Carolina (2.9 percent), Arkansas (3.2 percent), and South Carolina (3.3 percent) had the lowest unionization rates. (Tables 2 and 3 in the longer pdf version of this post show the same data separately for the private and public sectors within each state.)
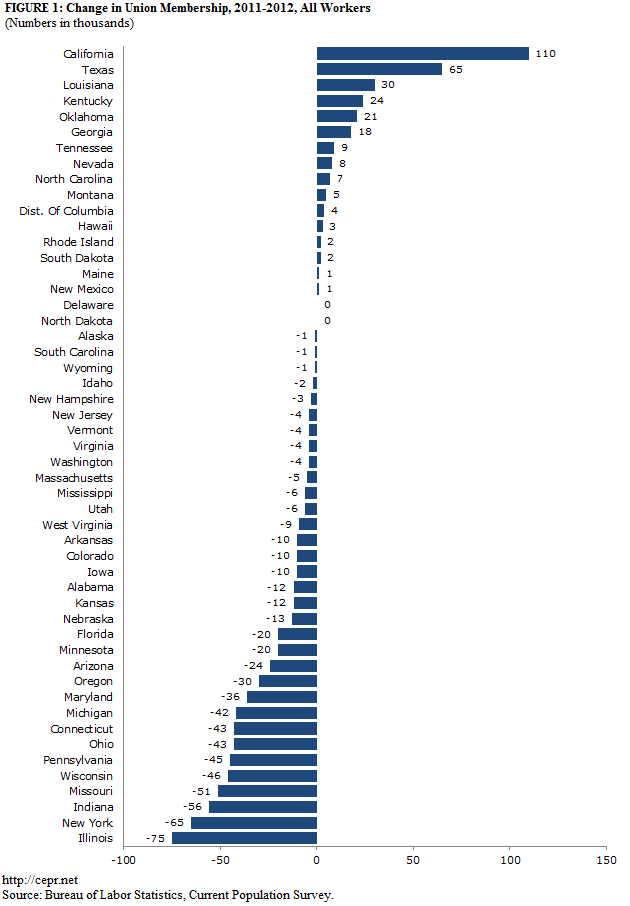
Figure 1 presents the change in overall union membership rate in each of the states. Between 2011 and 2012, union membership increased the most in California (up 110,000 union members), Texas (up 65,000), and Louisiana (up 30,000). Losses were biggest in Illinois (down 75,000), New York (down 65,000), and Indiana (down 56,000), with other large declines in Missouri (down 51,000), Wisconsin (down 46,000), Pennsylvania (down 45,000), Ohio (down 43,000), Connecticut (down 43,000), and Michigan (down 42,000).
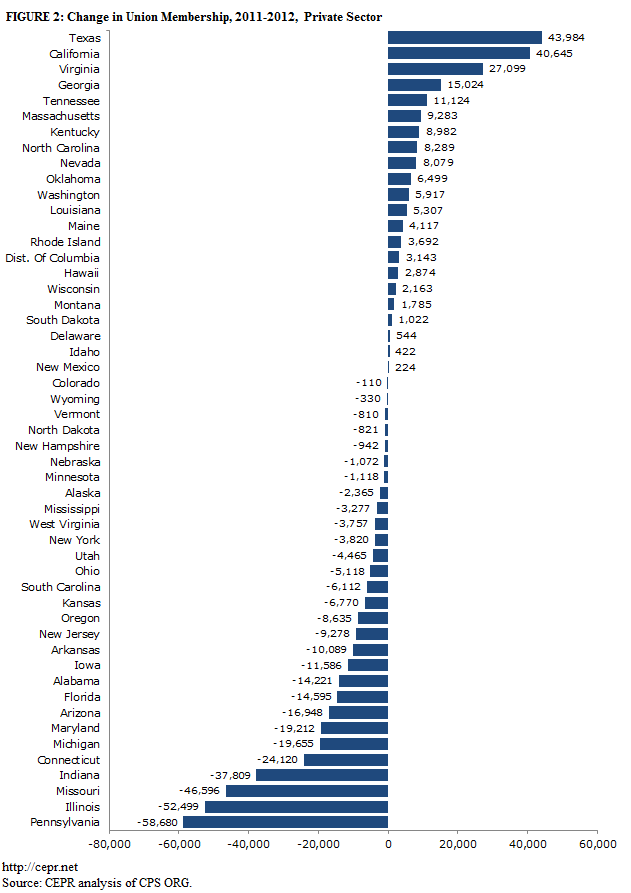
In the private sector (Figure 2), membership fell most in Pennsylvania (down 59,000), Illinois (down 52,000), Missouri (down 47,000), and Indiana (down 38,000). The biggest gains in private sector union membership were in Texas (up 44,000), California (up 41,000), and Virginia (up 27,000).
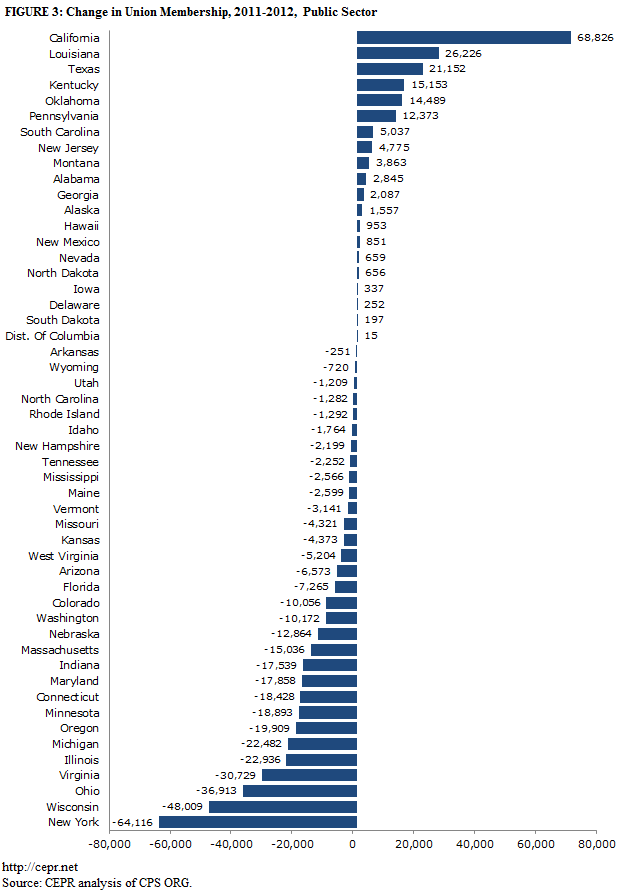
In the public sector (Figure 3), membership declines were largest in New York (down 64,000), Wisconsin (down 48,000), and Ohio (down 37,000). Membership increased the most in California (up 69,000), Louisiana (up 26,000), and Texas (up 21,000).
(For a printable version of this blog post, including tables with complete data, click here.)
* The publicly available CPS microdata have a slightly different weighting scheme than the one applied to the CPS microdata used by the BLS, so there are minor discrepancies between the official BLS data and our analysis.

