

January 22, 2021

Acknowledgements
The author would like to thank Dean Baker, Sarah Rawlins, Karen Conner, Aiden Lee, Simran Kalkat, and Matthew Sedlar for their assistance.
Overview
The overall union membership rate increased by half a percentage point in 2020, rising to 10.8 percent of all employed (Table 1). This represents the largest year-over-year gain since directly comparable data became available in the early 1980s. However, the number of union members declined by 321,000 in 2020 (Table 2), amid heavy job losses throughout the economy during the COVID-19 pandemic. The increase in union density reflects the fact that the percent decline in the number of employed was over three times larger for nonunion workers than for union members. A similar dynamic was observed in 2007 and 2008, following the financial crisis.
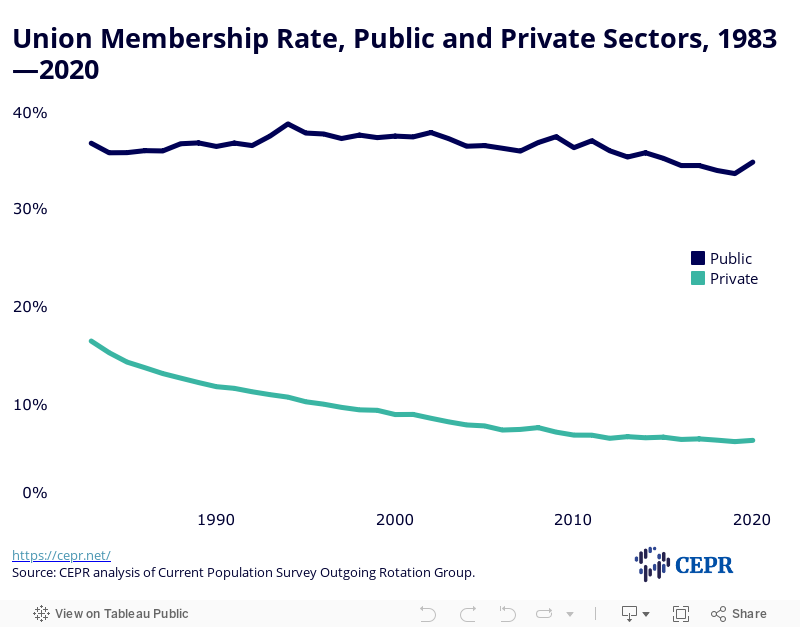
The union coverage rate increased by the same amount as the membership rate in 2020. The former grew to 12.1 percent, though the number of workers covered by a union contract fell by 444,000. Private sector unionization followed a similar pattern, albeit with a much more modest (0.1 percentage points to 6.3 percent) rise in the membership rate. This rate increase was accompanied by a loss of 428,000 private sector union members. By contrast, both the share and number of union members grew substantially in the public sector in 2020 (Figure 1). The former increased by 1.2 percentage points to 34.8 percent, while the latter grew by 107,000 workers. These gains are especially remarkable given concerted efforts in recent years to erode public sector collective bargaining.
Other notable highlights include:
-
Public sector unionization increased at all levels of government: federal, state, and local.
-
The gender gap continued to narrow in 2020. It is now only half a percentage point, down from ten percentage points in the early 1980s.
-
Both the share and the number of union members increased among Black and Hispanic workers, reflecting a long-term trend toward increased racial and ethnic diversity in the labor movement.
-
The historically highly unionized manufacturing industry saw a dip in the union membership rate, though it remains above the private sector average.
-
The state with the largest increase in the public sector unionization rate was Connecticut, which also had the second largest overall rate increase.
-
Nevada, once hailed as a state where labor unions had flourished in spite of right-to-work laws, experienced the largest statewide decline in the private sector union membership rate.
| (percent of employees) | |||||||
|---|---|---|---|---|---|---|---|
| Membership | Coverage | ||||||
| 2019 | 2020 | Change | 2019 | 2020 | Change | ||
| All | 10.3 | 10.8 | 0.5 | 11.6 | 12.1 | 0.5 | |
| Public sector | 33.6 | 34.8 | 1.2 | 37.2 | 38.4 | 1.2 | |
| Private sector | 6.2 | 6.3 | 0.1 | 7.1 | 7.2 | 0.1 | |
| Gender | |||||||
| Women | 9.7 | 10.5 | 0.8 | 11.0 | 11.8 | 0.8 | |
| Men | 10.8 | 11.0 | 0.2 | 12.1 | 12.3 | 0.2 | |
| Race or ethnicity | |||||||
| White | 10.3 | 10.7 | 0.4 | 11.5 | 12.0 | 0.5 | |
| Black | 11.2 | 12.3 | 1.1 | 12.7 | 13.9 | 1.2 | |
| Hispanic | 8.9 | 9.8 | 0.9 | 10.2 | 11.0 | 0.8 | |
| Asian | 8.8 | 8.9 | 0.1 | 10.0 | 10.0 | 0.0 | |
| Age | |||||||
| 16-24 | 4.4 | 4.4 | 0.0 | 5.2 | 5.2 | 0.0 | |
| 25-34 | 8.8 | 9.8 | 1.0 | 10.3 | 11.0 | 0.7 | |
| 35-44 | 11.8 | 12.2 | 0.4 | 13.1 | 13.5 | 0.4 | |
| 45-54 | 12.6 | 13.2 | 0.6 | 13.9 | 14.7 | 0.8 | |
| 55-64 | 12.7 | 13.0 | 0.3 | 14.1 | 14.5 | 0.4 | |
| 65 or over | 9.7 | 9.0 | -0.7 | 10.9 | 10.1 | -0.8 | |
| Education* | |||||||
| Less than high school | 5.3 | 5.4 | 0.2 | 6.2 | 6.2 | 0.0 | |
| High school | 9.6 | 10.0 | 0.4 | 10.7 | 11.0 | 0.4 | |
| Some college | 10.2 | 11.0 | 0.8 | 11.2 | 12.0 | 0.7 | |
| College | 9.9 | 10.0 | 0.1 | 11.3 | 11.6 | 0.3 | |
| Advanced Degree | 15.3 | 15.5 | 0.2 | 17.5 | 17.6 | 0.1 | |
| Nativity* | |||||||
| U.S. born | 10.7 | 11.2 | 0.5 | 12.0 | 12.5 | 0.5 | |
| Foreign born | 8.3 | 8.8 | 0.6 | 9.4 | 10.0 | 0.6 | |
Source: Data for all, public, private, gender, race/ethnicity and age, from Bureau of Labor Statistics (2021); * data for education and nativity from CEPR analysis of Current Population Survey Outgoing Rotation Group, for 2019–2020. Some differences in the third and sixth columns reflect rounding.
| (thousands of workers) | |||||||
|---|---|---|---|---|---|---|---|
| Membership | Coverage | ||||||
| 2019 | 2020 | Change | 2019 | 2020 | Change | ||
| All | 14,574 | 14,253 | -321 | 16,383 | 15,939 | -444 | |
| Public sector | 7,066 | 7,173 | 107 | 7,821 | 7,921 | 100 | |
| Private sector | 7,508 | 7,080 | -428 | 8,562 | 8,018 | -544 | |
| Gender | |||||||
| Women | 6,624 | 6,672 | 48 | 7,538 | 7,507 | -31 | |
| Men | 7,950 | 7,582 | -368 | 8,845 | 8,432 | -413 | |
| Race or ethnicity | |||||||
| White | 11,208 | 10,944 | -264 | 12,583 | 12,221 | -362 | |
| Black | 2,043 | 2,055 | 12 | 2,310 | 2,321 | 11 | |
| Hispanic | 2,258 | 2,315 | 57 | 2,590 | 2,586 | -4 | |
| Asian | 817 | 766 | -51 | 932 | 855 | -77 | |
| Age | |||||||
| 16-24 | 827 | 741 | -86 | 977 | 865 | -112 | |
| 25-34 | 2,973 | 3,071 | 98 | 3,464 | 3,455 | -9 | |
| 35-44 | 3,515 | 3,475 | -40 | 3,906 | 3,836 | -70 | |
| 45-54 | 3,543 | 3,469 | -74 | 3,918 | 3,868 | -50 | |
| 55-64 | 2,952 | 2,842 | -110 | 3,266 | 3,175 | -91 | |
| 65 or over | 764 | 656 | -108 | 852 | 740 | -112 | |
| Education* | |||||||
| Less than high school | 598 | 519 | -79 | 702 | 592 | -110 | |
| High school | 3,541 | 3,331 | -210 | 3,937 | 3,655 | -282 | |
| Some college | 3,998 | 3,919 | -79 | 4,415 | 4,274 | -140 | |
| College | 3,419 | 3,397 | -22 | 3,891 | 3,905 | 15 | |
| Advanced Degree | 3,011 | 3,085 | 74 | 3,430 | 3,509 | 79 | |
| Nativity* | |||||||
| U.S. born | 12,554 | 12,331 | -223 | 14,084 | 13,767 | -317 | |
| Foreign born | 2,012 | 1,919 | -93 | 2,291 | 2,169 | -122 | |
Source: Data for all, public, private, gender, race/ethnicity and age, from Bureau of Labor Statistics (2021); * data for education and nativity from CEPR analysis of Current Population Survey Outgoing Rotation Group, for 2019–2020. Some differences in the third and sixth columns reflect rounding.
Figure 1
Demographic Trends
Union membership has diversified significantly over the last several decades. In 1989, nearly half of all union workers were white men; their share now sits at less than a third.
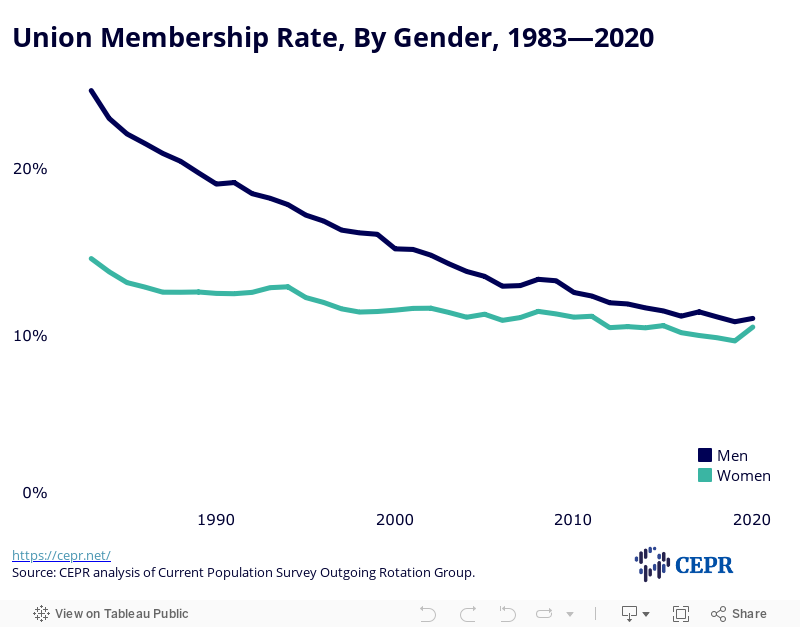
Growth in union membership was especially pronounced among women in 2020, and the gender gap in unionization narrowed for the third year in a row (Figure 2). The membership rate for women increased by 0.8 percentage points to 10.5 percent, and the number grew by 48,000. Men’s membership rate increased by 0.2 percentage points to 11.0 percent, accompanied by a loss of over 368,000 members. The gender gap in union membership rates is now only half a percentage point, having shrunk from a whopping ten percentage points in 1983.
Figure 2
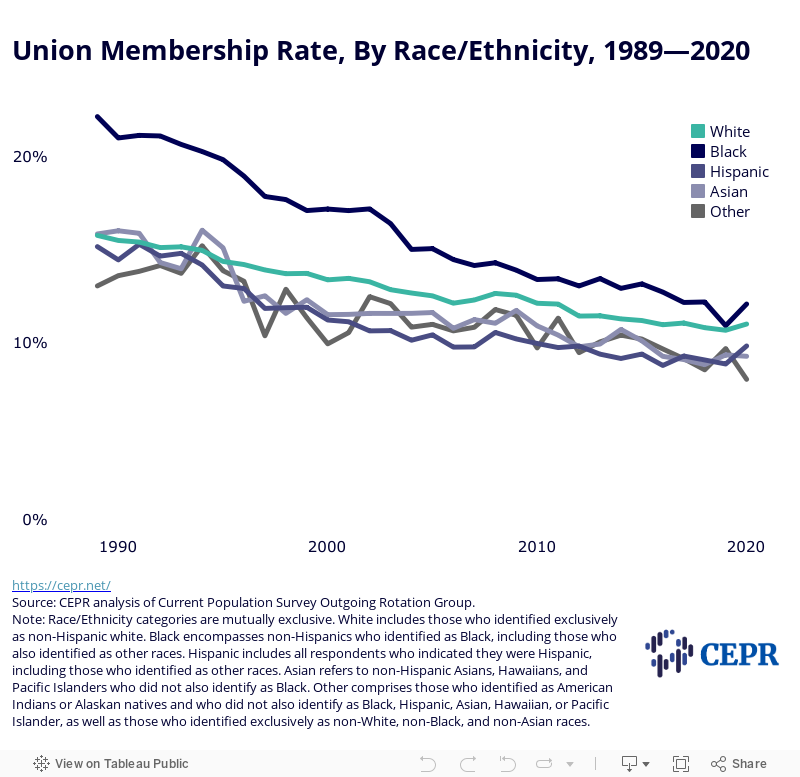
Black and Hispanic membership gains were also notable in 2020. (Figure 3). Black union membership grew by 1.1 percentage points to 12.3 percent, and increased by 12,000 workers. The unionization rate for Hispanics increased by 0.9 percentage points to 9.8 percent, and the number of members swelled by 57,000. The unionization rate for whites increased by 0.4 percentage points to 10.7 percent, but the number of members fell by 264,000. Similarly, the Asian union membership share increased by 0.1 percentage points to 8.9 percent, but the number of members declined by 51,000 members, respectively.
Figure 3
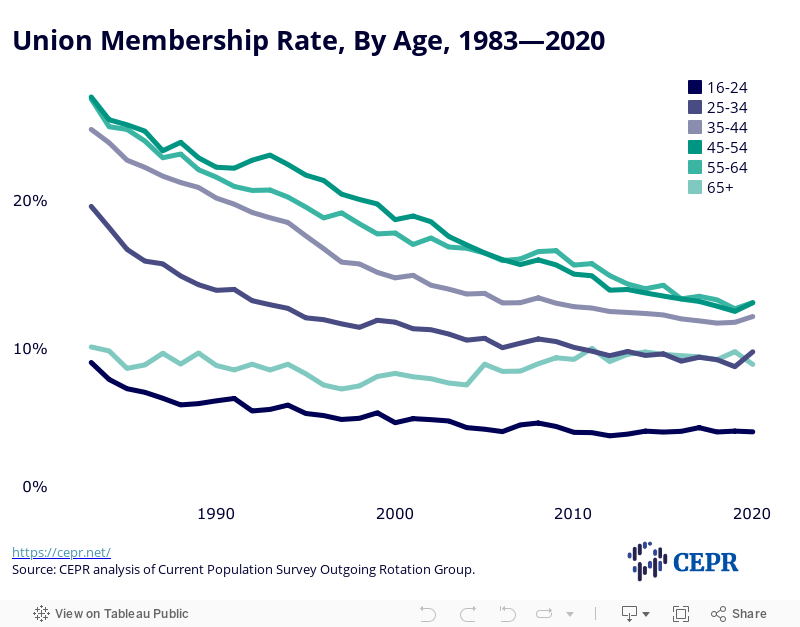
Union membership rates increased for all but the youngest and oldest age groups (Figure 4). The most pronounced upturn occurred among workers ages 25–34, rising by 1.0 percentage points to 9.8 percent. This group was also the only cohort that experienced growth in the number of members, swelling by 98,000 workers. Perhaps unsurprisingly given the pandemic, steep declines occurred among workers 65 and older. Their membership rate fell by 0.7 percentage points to 9 percent, alongside an exodus of 108,000 members in this age category.
Figure 4
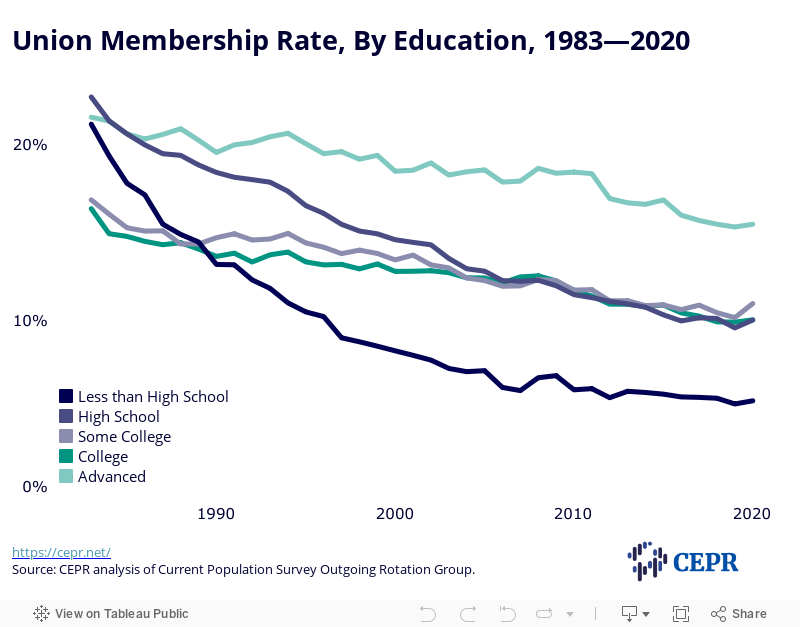
Union membership rates also increased across all education levels (Figure 5). Those with some college but no bachelor’s degree experienced the largest bump, and their membership rate rose 0.8 percentage points to 11.0 percent. As measured by the number of union members, the steepest declines were among high school graduates, whose membership contracted by 210,000 workers. However, this group also experienced the second largest bump in membership rates, which rose by 0.4 percentage points to 10.0 percent. Those with advanced degrees were the only educational group in which the number of union members increased. Their membership grew by 74,000 workers, alongside a 0.2 percentage point increase in their membership share to 15.5 percent.
Figure 5
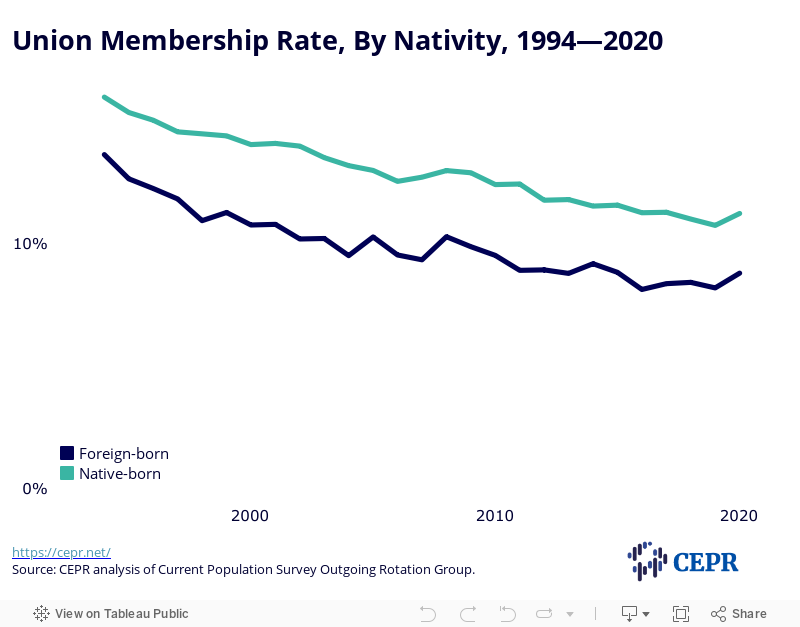
Native-born workers remain more likely than foreign-born workers to be union members, and the gap between these groups remains little changed from 2019 (Figure 6). The rate of union membership grew for both foreign- and native-born workers, with the former’s increasing by 0.6 points to 8.8 percent, and the latter’s by 0.5 points to 11.2 percent. Membership totals, meanwhile, shrunk by 223,000 among the native.-born and 93,000 among the foreign-born.
Figure 6
Industry and Occupation Trends by Sector
Table 3 shows union membership by industry and sector. In the private sector, the most marked growth in membership rates occurred in mining, quarrying, and oil and gas extraction (up 1.6 percentage points), followed by educational services (up 1.2 percentage points). The most substantial private sector unionization rate declines were in non-internet broadcasting (down 3.4 percentage points); utilities (down 2.9 percentage points); and arts, entertainment, and recreation (down 1.8 percentage points).
Nearly all private sector industries lost union members in 2020, though leisure and hospitality was hardest hit (down 161,000), followed by manufacturing (down 110,000). The number of union members grew in retail trade (up 57,000); mining quarrying, and oil and gas extraction (up 9,000); finance and insurance (also up 9,000); and transportation and warehousing (up 4,000).
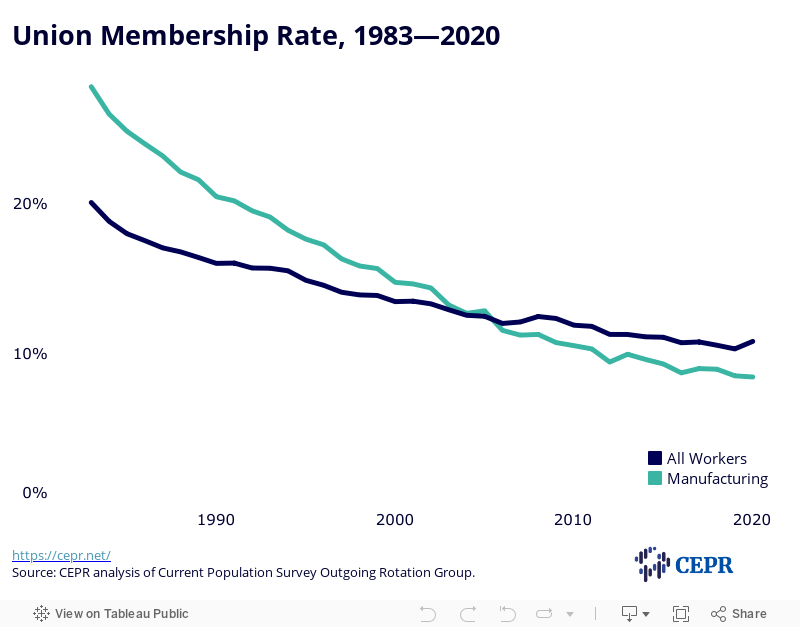
The slight downtick in the manufacturing unionization rate is notable in a year when rates rose in so many other industries. The decline in 2020 was slight, and the union membership share in manufacturing is still above the private sector average. However, while manufacturing was historically a heavily unionized industry (Figure 7), it is clear that that is no longer the case.
Public sector union membership grew at every level in 2020. The most pronounced rate increase was in local government, where the union membership share grew by 2.3 percentage points to 41.7 percent. The unionization rate also increased at the federal and state levels, by 0.4 percentage points and 0.5 percentage points, respectively. Federal and state government each added 42,000 union members in 2020, while local government added 24,000.
| Membership Rate | Number of Members | ||||||
|---|---|---|---|---|---|---|---|
| (percent of employees) | (thousands of employees) | ||||||
| 2019 | 2020 | Change | 2019 | 2020 | Change | ||
| Private Sector | 6.2 | 6.3 | 0.1 | 7,508 | 7,080 | -428 | |
| Agriculture & related industries | 1.7 | 1.7 | -0.1 | 23 | 21 | -2 | |
| Nonagricultural industries | 6.3 | 6.4 | 0.1 | 7,485 | 7,059 | -426 | |
| Mining, quarrying, and oil and gas extraction |
4.0 | 5.6 | 1.6 | 28 | 37 | 9 | |
| Construction | 12.6 | 12.7 | 0.0 | 1,055 | 993 | -62 | |
| Manufacturing | 8.6 | 8.5 | -0.1 | 1,291 | 1,181 | -110 | |
| Durable Goods | 8.8 | 8.7 | -0.2 | 835 | 754 | -81 | |
| Nondurable goods | 8.2 | 8.2 | 0.0 | 455 | 427 | -28 | |
| Wholesale and retail trade | 4.1 | 4.5 | 0.4 | 741 | 787 | 46 | |
| Wholesale trade | 4.5 | 4.3 | -0.3 | 143 | 133 | -10 | |
| Retail Trade | 4.0 | 4.6 | 0.6 | 598 | 655 | 57 | |
| Transportation and utilities | 17.3 | 17.6 | 0.4 | 1,166 | 1,135 | -31 | |
| Transportation and warehousing | 16.1 | 17.0 | 0.9 | 912 | 916 | 4 | |
| Utilities | 23.4 | 20.6 | -2.9 | 254 | 219 | -35 | |
| Information* | 10.3 | 9.3 | -1.0 | 242 | 200 | -41 | |
| Publishing, except internet | 3.3 | 2.4 | -0.9 | 12 | 8 | -3 | |
| Motion pictures and sound recording industries |
13.6 | 14.0 | 0.4 | 53 | 40 | -13 | |
| Broadcasting (except internet) | 11.0 | 7.6 | -3.4 | 53 | 30 | -23 | |
| Telecommunications | 14.1 | 14.3 | 0.2 | 115 | 111 | -4 | |
| Financial activities | 1.9 | 1.9 | -0.1 | 182 | 169 | -13 | |
| Finance and insurance | 1.2 | 1.4 | 0.1 | 87 | 96 | 9 | |
| Finance | 1.1 | 1.2 | 0.1 | 49 | 53 | 4 | |
| Insurance | 1.4 | 1.7 | 0.3 | 37 | 43 | 6 | |
| Real estate and rental and leasing | 4.0 | 3.5 | -0.6 | 95 | 74 | -21 | |
| Professional and business services | 2.2 | 2.2 | 0.0 | 339 | 323 | -16 | |
| Professional and technical services | 1.4 | 1.3 | -0.1 | 143 | 132 | -10 | |
| Management, administrative, and waste services | 3.6 | 4.0 | 0.4 | 197 | 191 | -7 | |
| Education and health services | 8.0 | 8.4 | 0.5 | 1,885 | 1,876 | -9 | |
| Educational services | 12.3 | 13.5 | 1.2 | 608 | 607 | -1 | |
| Health care and social assistance | 6.8 | 7.1 | 0.3 | 1,278 | 1,269 | -9 | |
| Leisure and hospitality | 2.9 | 2.2 | -0.7 | 384 | 223 | -161 | |
| Arts, entertainment, and recreation | 6.6 | 4.8 | -1.8 | 164 | 86 | -79 | |
| Accommodation and food services | 2.1 | 1.6 | -0.5 | 220 | 137 | -83 | |
| Accommodation | 6.5 | 5.7 | -0.8 | 93 | 52 | -41 | |
| Food services and drinking places | 1.4 | 1.2 | -0.2 | 128 | 85 | -43 | |
| Other services* | 2.8 | 2.5 | -0.3 | 172 | 134 | -38 | |
| Other services, except private households | 3.1 | 2.8 | -0.3 | 163 | 130 | -33 | |
| Public Sector | 33.6 | 34.8 | 1.2 | 7,066 | 7,173 | 107 | |
| Federal Government | 25.6 | 26.0 | 0.4 | 974 | 1,014 | 40 | |
| State Government | 29.4 | 29.9 | 0.5 | 2,043 | 2,085 | 42 | |
| Local Government | 39.4 | 41.7 | 2.3 | 4,050 | 4,074 | 24 | |
*Includes other industries, not shown separately.
Source: Data from Bureau of Labor Statistics (2021). Some differences in columns three and six reflect rounding.
Figure 7
Tables 4 and 5 show union membership by occupation and sector. The union membership share in public sector farming, fishing, and forestry occupations more than doubled in 2020, increasing by 14.3 percentage points to 24 percent (compared to 9.7 percent in 2019). Public sector unionization rates also rose in transportation and material moving occupations (up 3.7 percentage points), as well as in installation, maintenance, and repair occupations and production occupations (both up 2.7 percentage points).
The number of union members increased in public sector health care support occupations (61,000), protective service occupations (50,000), and professional and related occupations (75,000). Within the latter, there was an especially notable increase in the number of union members in the education, training, and library occupations subcategory (up 22,000).
Public sector membership shares fell most dramatically in personal care and service occupations (down 2.7 percentage points), and health care support occupations (down 2.2 percentage points). The former also experienced the biggest public sector contraction in members, losing 90,000 union workers.
Private sector union membership shares grew most in protective service occupations, up 2.3 percentage points to 9.5 percent. Within professional and related occupations, the unionization rate for those in education, training, and library occupations also increased by 2.1 percentage points to 14.2 percent. Private sector unionization rates fell most markedly in personal care and service occupations (down 1.2 percentage points), and office and administrative support occupations (down 0.6 percentage points). Office and administrative support occupations also lost the most union members (down 180,000) within private sector occupations.
| (percent of employees) | |||||||
|---|---|---|---|---|---|---|---|
| Private Sector | Public Sector | ||||||
| 2019 | 2020 | Change | 2019 | 2020 | Change | ||
| Management, business, and financial operations occupations | 2.2 | 2.1 | -0.1 | 19.8 | 19.6 | -0.2 | |
| Professional and related occupations* | 6.7 | 6.7 | 0.0 | 37.8 | 38.9 | 1.1 | |
| Community and social service occupations | 5.3 | 4.8 | -0.4 | 36.3 | 36.0 | -0.3 | |
| Education, training, and library occupations | 12.1 | 14.2 | 2.1 | 45.7 | 48.3 | 2.6 | |
| Healthcare practitioner and technical occupations | 9.4 | 9.5 | 0.1 | 31.5 | 29.7 | -1.8 | |
| Healthcare support occupations | 6.1 | 6.2 | 0.0 | 25.2 | 23.0 | -2.2 | |
| Protective service occupations | 7.2 | 9.5 | 2.3 | 46.9 | 48.9 | 2.0 | |
| Food preparation and serving related occupations | 2.7 | 2.4 | -0.3 | 20.8 | 22.2 | 1.4 | |
| Building and grounds cleaning and maintenance occupations | 5.5 | 6.2 | 0.7 | 29.3 | 31.5 | 2.3 | |
| Personal care and service occupations | 3.4 | 2.2 | -1.2 | 21.5 | 18.8 | -2.7 | |
| Sales and related occupations | 2.6 | 3.1 | 0.4 | 17.3 | 15.6 | -1.8 | |
| Office and administrative support occupations | 4.5 | 3.9 | -0.6 | 30.6 | 31.8 | 1.3 | |
| Farming, fishing, and forestry occupations | 1.8 | 2.0 | 0.2 | 9.7 | 24.0 | 14.3 | |
| Construction and extraction occupations | 16.2 | 16.4 | 0.3 | 33.7 | 34.5 | 0.9 | |
| Installation, maintenance, and repair occupations | 12.7 | 12.7 | 0.0 | 31.3 | 34.0 | 2.7 | |
| Production occupations | 11.1 | 11.1 | 0.0 | 30.0 | 32.8 | 2.7 | |
| Transportation and material moving occupations | 12.5 | 12.8 | 0.4 | 32.4 | 36.1 | 3.7 | |
*Includes other occupation categories, not shown separately.
Source: Data from CEPR analysis of Current Population Survey Outgoing Rotation Group, 2019-2020. Some differences in columns three and six reflect rounding.
| (thousands of employees) | |||||||
|---|---|---|---|---|---|---|---|
| Private Sector | Public Sector | ||||||
| 2019 | 2020 | Change | 2019 | 2020 | Change | ||
| Management, business, and financial operations occupations | 419 | 404 | -16 | 535 | 558 | 22 | |
| Professional and related occupations* | 1,672 | 1,629 | -43 | 3,643 | 3,718 | 75 | |
| Community and social service occupations | 92 | 82 | -11 | 316 | 319 | 4 | |
| Education, training, and library occupations | 418 | 444 | 26 | 2,637 | 2,658 | 22 | |
| Healthcare practitioner and technical occupations | 765 | 757 | -8 | 310 | 312 | 2 | |
| Healthcare support occupations | 207 | 254 | 47 | 60 | 121 | 61 | |
| Protective service occupations | 73 | 89 | 16 | 963 | 1,013 | 50 | |
| Food preparation and serving related occupations | 218 | 148 | -69 | 77 | 71 | -6 | |
| Building and grounds cleaning and maintenance occupations | 235 | 218 | -17 | 197 | 177 | -21 | |
| Personal care and service occupations | 137 | 46 | -91 | 127 | 37 | -90 | |
| Sales and related occupations | 350 | 366 | 16 | 26 | 23 | -3 | |
| Office and administrative support occupations | 656 | 476 | -180 | 850 | 868 | 18 | |
| Farming, fishing, and forestry occupations | 19 | 18 | -1 | 3 | 6 | 4 | |
| Construction and extraction occupations | 1,034 | 955 | -79 | 158 | 150 | -8 | |
| Installation, maintenance, and repair occupations | 524 | 495 | -29 | 115 | 124 | 9 | |
| Production occupations | 895 | 783 | -112 | 79 | 84 | 6 | |
| Transportation and material moving occupations | 1,068 | 1,201 | 133 | 226 | 219 | -7 | |
*Includes other occupation categories, not shown separately.
Source: Data from CEPR analysis of Current Population Survey Outgoing Rotation Group, 2019-2020. Some differences in columns three and six reflect rounding.
Geographic Trends by Sector
Tables 6 and 7 and Figures 8, 9, and 10 show union membership by state and sector. In 2020, the largest share increases took place in Maine (up 2.9 percentage points), followed by Connecticut (up 2.6 percentage points), Minnesota (up 2.1 percentage points), and Oregon and Maryland (both up 1.8 percentage points). Texas added the most union members (66,000), followed by Pennsylvania (41,000), Minnesota (34,000), North Carolina (27,000), and Ohio (27,000).
Washington state supplanted New York with the largest overall reduction in members in 2020. The number of union workers in those states declined by 81,000 and 71,000, respectively. Significant drops also occurred in California (down 63,000), Missouri (down 59,000), and Colorado (down 55,000). Missouri experienced the largest drop in membership share (down 1.7 percentage points), followed by Colorado (down 1.6 percentage points), Washington (down 1.4 percentage points), South Dakota (1.3 percentage points), and Nevada (down 1.2 percentage points).
The greatest increase in the number of public sector union members was in Texas (up 67,000), while the largest decrease was in Florida (down 45,000). Annual changes in public sector membership rates ranged from an 11.4 percentage point increase in Connecticut to a 7.9 percentage point decrease in South Dakota.
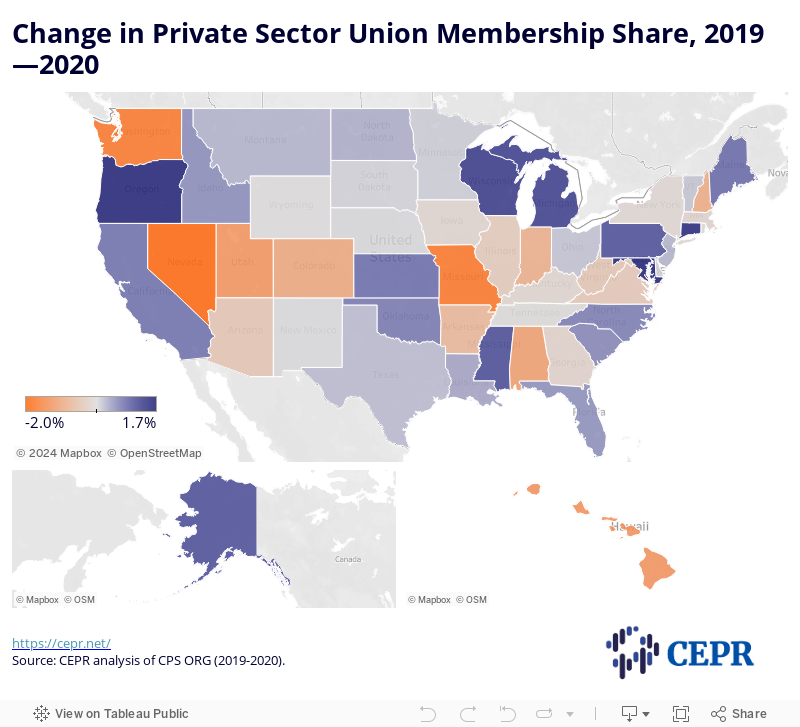
In the private sector, the biggest jump in the number of union members took place in Pennsylvania (up 27,000), while the largest drop occurred in New York (down 95,000). Maryland saw the biggest increase in its private sector unionization rate (up 1.7 percentage points), while Nevada saw the largest decline (down 2.0 percentage points). The situation in Nevada is especially striking, as the state had previously been held up as an example of how unions could flourish in spite of right-to-work legislation.
| (percent of employees) | |||||||||||
|---|---|---|---|---|---|---|---|---|---|---|---|
| All | Public Sector | Private Sector | |||||||||
| 2019 | 2020 | Change | 2019 | 2020 | Change | 2019 | 2020 | Change | |||
| Alabama | 8.5 | 8.0 | -0.5 | 19.0 | 20.9 | 2.0 | 6.5 | 5.4 | -1.1 | ||
| Alaska | 17.1 | 17.7 | 0.6 | 39.8 | 41.1 | 1.3 | 8.4 | 9.5 | 1.1 | ||
| Arizona | 5.7 | 5.3 | -0.4 | 20.2 | 19.3 | -0.8 | 3.4 | 3.0 | -0.5 | ||
| Arkansas | 5.2 | 4.7 | -0.5 | 9.3 | 10.4 | 1.2 | 4.3 | 3.6 | -0.7 | ||
| California | 15.2 | 16.2 | 1.0 | 52.6 | 51.7 | -0.9 | 8.8 | 9.6 | 0.8 | ||
| Colorado | 9.0 | 7.4 | -1.6 | 24.2 | 19.5 | -4.7 | 6.0 | 5.0 | -1.0 | ||
| Connecticut | 14.5 | 17.1 | 2.6 | 62.7 | 74.1 | 11.4 | 7.1 | 8.6 | 1.6 | ||
| Delaware | 8.7 | 9.7 | 1.0 | 34.8 | 38.2 | 3.4 | 4.4 | 4.5 | 0.1 | ||
| District of Columbia | 9.3 | 8.6 | -0.7 | 20.5 | 18.0 | -2.5 | 5.3 | 4.7 | -0.6 | ||
| Florida | 6.2 | 6.4 | 0.2 | 26.5 | 24.8 | -1.7 | 3.1 | 3.6 | 0.5 | ||
| Georgia | 4.1 | 4.6 | 0.5 | 9.1 | 14.1 | 5.0 | 3.2 | 3.0 | -0.2 | ||
| Hawaii | 23.5 | 23.7 | 0.2 | 52.7 | 53.7 | 1.0 | 14.6 | 13.3 | -1.3 | ||
| Idaho | 4.9 | 5.6 | 0.7 | 17.4 | 17.2 | -0.3 | 3.0 | 3.5 | 0.5 | ||
| Illinois | 13.6 | 14.3 | 0.7 | 45.8 | 55.0 | 9.2 | 8.9 | 8.5 | -0.4 | ||
| Indiana | 8.3 | 8.3 | 0.0 | 21.0 | 26.9 | 6.0 | 6.7 | 5.8 | -0.9 | ||
| Iowa | 6.3 | 6.6 | 0.3 | 18.5 | 20.6 | 2.1 | 4.0 | 3.8 | -0.2 | ||
| Kansas | 8.7 | 8.9 | 0.2 | 22.5 | 20.9 | -1.7 | 5.6 | 6.4 | 0.8 | ||
| Kentucky | 8.0 | 7.5 | -0.5 | 16.6 | 12.2 | -4.4 | 6.7 | 6.5 | -0.1 | ||
| Louisiana | 5.3 | 5.9 | 0.6 | 14.1 | 15.4 | 1.4 | 3.4 | 3.8 | 0.4 | ||
| Maine | 11.8 | 14.7 | 2.9 | 45.7 | 46.6 | 0.9 | 5.6 | 6.4 | 0.8 | ||
| Maryland | 11.3 | 13.1 | 1.8 | 33.5 | 33.5 | 0.1 | 4.6 | 6.3 | 1.7 | ||
| Massachusetts | 12.0 | 12.0 | 0.0 | 51.2 | 53.8 | 2.7 | 6.6 | 6.4 | -0.2 | ||
| Michigan | 13.6 | 15.2 | 1.6 | 45.1 | 44.2 | -0.9 | 9.8 | 11.1 | 1.3 | ||
| Minnesota | 13.7 | 15.8 | 2.1 | 53.7 | 61.5 | 7.8 | 7.4 | 7.5 | 0.1 | ||
| Mississippi | 6.3 | 7.1 | 0.8 | 16.2 | 16.5 | 0.3 | 4.1 | 5.2 | 1.1 | ||
| Missouri | 11.1 | 9.4 | -1.7 | 28.1 | 27.8 | -0.3 | 8.2 | 6.4 | -1.8 | ||
| Montana | 10.5 | 12.0 | 1.5 | 34.5 | 38.2 | 3.7 | 5.3 | 5.6 | 0.3 | ||
| Nebraska | 8.4 | 9.6 | 1.2 | 28.0 | 35.1 | 7.1 | 4.6 | 4.6 | 0.0 | ||
| Nevada | 14.6 | 13.4 | -1.2 | 32.9 | 34.8 | 1.9 | 11.6 | 9.6 | -2.0 | ||
| New Hampshire | 10.3 | 9.8 | -0.5 | 44.7 | 44.1 | -0.6 | 5.2 | 4.3 | -0.9 | ||
| New Jersey | 15.7 | 16.1 | 0.4 | 58.1 | 59.3 | 1.2 | 8.0 | 8.3 | 0.3 | ||
| New Mexico | 7.1 | 7.1 | 0.0 | 17.2 | 16.7 | -0.5 | 3.6 | 3.7 | 0.0 | ||
| New York | 21.0 | 22.0 | 1.0 | 65.5 | 68.3 | 2.8 | 12.7 | 12.6 | -0.1 | ||
| North Carolina | 2.3 | 3.1 | 0.8 | 8.5 | 11.1 | 2.6 | 1.2 | 1.8 | 0.7 | ||
| North Dakota | 6.0 | 6.2 | 0.2 | 19.1 | 18.1 | -1.0 | 3.3 | 3.7 | 0.3 | ||
| Ohio | 11.9 | 13.2 | 1.3 | 42.4 | 45.5 | 3.1 | 6.9 | 7.1 | 0.2 | ||
| Oklahoma | 6.2 | 6.0 | -0.2 | 20.4 | 15.4 | -5.0 | 3.1 | 3.8 | 0.7 | ||
| Oregon | 14.4 | 16.2 | 1.8 | 53.2 | 52.3 | -0.9 | 7.3 | 9.0 | 1.6 | ||
| Pennsylvania | 12.0 | 13.5 | 1.5 | 52.6 | 53.8 | 1.2 | 7.1 | 8.2 | 1.1 | ||
| Rhode Island | 17.4 | 17.8 | 0.4 | 62.3 | 67.2 | 4.9 | 10.0 | 9.9 | 0.0 | ||
| South Carolina | 2.2 | 2.9 | 0.7 | 7.4 | 8.2 | 0.8 | 1.3 | 1.9 | 0.6 | ||
| South Dakota | 5.6 | 4.3 | -1.3 | 21.3 | 13.4 | -7.9 | 2.6 | 2.7 | 0.1 | ||
| Tennessee | 4.6 | 4.4 | -0.2 | 14.7 | 13.5 | -1.2 | 2.9 | 2.8 | 0.0 | ||
| Texas | 4.0 | 4.9 | 0.9 | 14.2 | 17.2 | 3.0 | 2.5 | 2.7 | 0.2 | ||
| Utah | 4.4 | 3.7 | -0.7 | 11.1 | 12.7 | 1.5 | 3.1 | 1.8 | -1.3 | ||
| Vermont | 11.2 | 11.8 | 0.6 | 42.8 | 41.5 | -1.3 | 5.3 | 5.5 | 0.2 | ||
| Virginia | 4.0 | 4.4 | 0.4 | 9.9 | 12.6 | 2.7 | 2.5 | 2.1 | -0.4 | ||
| Washington | 18.8 | 17.4 | -1.4 | 52.3 | 50.6 | -1.7 | 12.0 | 10.3 | -1.8 | ||
| West Virginia | 10.2 | 10.7 | 0.5 | 21.2 | 24.7 | 3.5 | 7.8 | 7.3 | -0.5 | ||
| Wisconsin | 8.1 | 8.7 | 0.6 | 25.7 | 22.1 | -3.6 | 5.1 | 6.5 | 1.3 | ||
| Wyoming | 7.3 | 7.6 | 0.3 | 13.6 | 14.1 | 0.5 | 5.1 | 5.1 | 0.0 | ||
Source: “All” category from Bureau of Labor Statistics (2021); public and private sector data from CEPR analysis of Current Population Survey Outgoing Rotation Group, 2019-2020. Some differences in columns three, six, and nine reflect rounding.
| (thousands of employees) | |||||||||||
|---|---|---|---|---|---|---|---|---|---|---|---|
| All | Public Sector | Private Sector | |||||||||
| 2019 | 2020 | Change | 2019 | 2020 | Change | 2019 | 2020 | Change | |||
| Alabama | 173 | 151 | -22 | 62 | 66 | 4 | 112 | 85 | -27 | ||
| Alaska | 48 | 49 | 1 | 31 | 30 | -2 | 17 | 20 | 3 | ||
| Arizona | 174 | 155 | -19 | 84 | 80 | -4 | 90 | 74 | -16 | ||
| Arkansas | 62 | 55 | -7 | 18 | 19 | 1 | 44 | 35 | -9 | ||
| California | 2,504 | 2,441 | -63 | 1,253 | 1,218 | -35 | 1,247 | 1,221 | -26 | ||
| Colorado | 237 | 182 | -55 | 107 | 79 | -28 | 132 | 104 | -28 | ||
| Connecticut | 244 | 262 | 18 | 141 | 146 | 5 | 103 | 115 | 11 | ||
| Delaware | 38 | 41 | 3 | 21 | 26 | 5 | 16 | 16 | 0 | ||
| District of Columbia | 34 | 30 | -4 | 19 | 18 | -1 | 14 | 11 | -3 | ||
| Florida | 551 | 524 | -27 | 319 | 274 | -45 | 233 | 252 | 19 | ||
| Georgia | 180 | 194 | 14 | 60 | 90 | 29 | 119 | 104 | -15 | ||
| Hawaii | 135 | 120 | -15 | 70 | 70 | 0 | 64 | 50 | -14 | ||
| Idaho | 37 | 41 | 4 | 18 | 19 | 1 | 20 | 22 | 2 | ||
| Illinois | 771 | 739 | -32 | 334 | 350 | 17 | 438 | 386 | -52 | ||
| Indiana | 249 | 235 | -14 | 71 | 90 | 18 | 178 | 145 | -33 | ||
| Iowa | 97 | 93 | -4 | 46 | 48 | 2 | 51 | 44 | -7 | ||
| Kansas | 112 | 114 | 2 | 53 | 45 | -7 | 58 | 68 | 10 | ||
| Kentucky | 144 | 127 | -17 | 41 | 34 | -6 | 102 | 92 | -10 | ||
| Louisiana | 94 | 99 | 5 | 44 | 47 | 3 | 50 | 52 | 2 | ||
| Maine | 69 | 82 | 13 | 42 | 53 | 11 | 28 | 28 | 1 | ||
| Maryland | 330 | 351 | 21 | 226 | 226 | 0 | 103 | 126 | 23 | ||
| Massachusetts | 406 | 357 | -49 | 209 | 188 | -21 | 197 | 170 | -28 | ||
| Michigan | 589 | 604 | 15 | 212 | 218 | 6 | 379 | 387 | 8 | ||
| Minnesota | 364 | 398 | 34 | 193 | 238 | 46 | 171 | 160 | -10 | ||
| Mississippi | 70 | 74 | 4 | 33 | 30 | -3 | 37 | 44 | 8 | ||
| Missouri | 297 | 238 | -59 | 111 | 98 | -13 | 185 | 139 | -46 | ||
| Montana | 46 | 50 | 4 | 27 | 31 | 5 | 19 | 19 | 0 | ||
| Nebraska | 75 | 85 | 10 | 40 | 51 | 11 | 34 | 34 | 0 | ||
| Nevada | 201 | 161 | -40 | 63 | 63 | 0 | 138 | 99 | -39 | ||
| New Hampshire | 69 | 62 | -7 | 39 | 38 | -1 | 31 | 23 | -7 | ||
| New Jersey | 642 | 600 | -42 | 363 | 336 | -27 | 279 | 262 | -17 | ||
| New Mexico | 58 | 53 | -5 | 36 | 33 | -2 | 22 | 20 | -2 | ||
| New York | 1,732 | 1,661 | -71 | 849 | 874 | 25 | 883 | 789 | -95 | ||
| North Carolina | 102 | 129 | 27 | 59 | 65 | 6 | 44 | 65 | 22 | ||
| North Dakota | 21 | 21 | 0 | 11 | 11 | 0 | 10 | 10 | 0 | ||
| Ohio | 610 | 637 | 27 | 305 | 347 | 42 | 305 | 288 | -18 | ||
| Oklahoma | 96 | 90 | -6 | 58 | 44 | -13 | 39 | 46 | 7 | ||
| Oregon | 255 | 275 | 20 | 145 | 148 | 3 | 110 | 126 | 16 | ||
| Pennsylvania | 676 | 717 | 41 | 319 | 335 | 16 | 357 | 384 | 27 | ||
| Rhode Island | 83 | 81 | -2 | 42 | 42 | 0 | 40 | 39 | -1 | ||
| South Carolina | 47 | 59 | 12 | 24 | 27 | 3 | 23 | 32 | 9 | ||
| South Dakota | 22 | 17 | -5 | 13 | 8 | -6 | 9 | 9 | 0 | ||
| Tennessee | 135 | 117 | -18 | 62 | 52 | -10 | 72 | 65 | -7 | ||
| Texas | 497 | 563 | 66 | 230 | 298 | 67 | 267 | 268 | 1 | ||
| Utah | 62 | 51 | -11 | 25 | 31 | 5 | 36 | 21 | -16 | ||
| Vermont | 33 | 31 | -2 | 20 | 19 | 0 | 13 | 12 | -1 | ||
| Virginia | 156 | 164 | 8 | 80 | 105 | 25 | 76 | 59 | -17 | ||
| Washington | 638 | 557 | -81 | 298 | 286 | -12 | 339 | 271 | -68 | ||
| West Virginia | 72 | 71 | -1 | 26 | 31 | 5 | 45 | 40 | -6 | ||
| Wisconsin | 218 | 227 | 9 | 99 | 84 | -15 | 119 | 143 | 25 | ||
| Wyoming | 18 | 18 | 0 | 8 | 9 | 1 | 9 | 9 | 0 | ||
Source: “All” category from Bureau of Labor Statistics (2021); public and private sector data from CEPR analysis of Current Population Survey Outgoing Rotation Group, 2019-2020. Some differences in columns three, six, and nine reflect rounding.
Figure 8
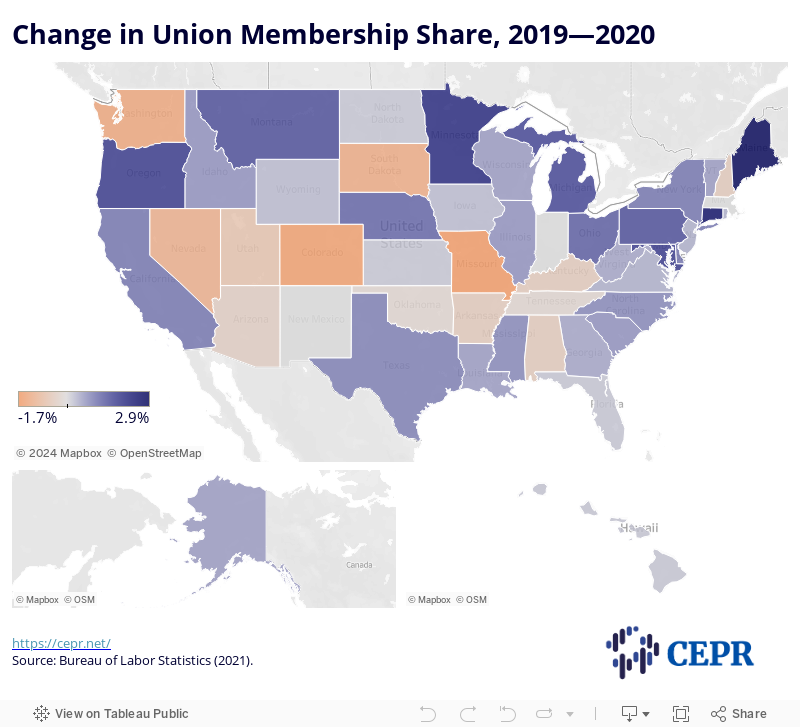
Figure 9
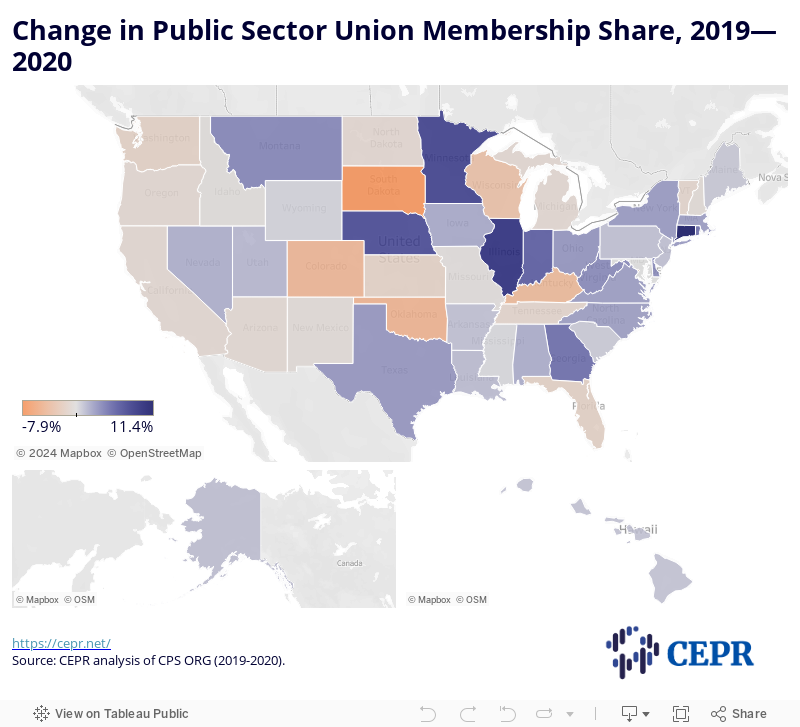
Figure 10
References
Bureau of Labor Statistics. 2021. “Union Members — 2020.” Washington, D.C.: Bureau of Labor Statistics. http://www.bls.gov/news.release/pdf/union2.pdf.
Economic Policy Institute. 2021. Current Population Survey Extracts, Version 1.0.13, https://microdata.epi.org.
Economic Policy Institute. 2018. “The concerted attack on public sector union workers is a coordinated effort financed by wealthy donors”. Washington DC: Economic Policy Institute. https://www.epi.org/press/the-concerted-attack-on-public-sector-union-workers-is-a-coordinated-effort-financed-by-wealthy-donors/.
Garcia, Ruben. 2018. “Nevada’s unions show how organized labor can flourish even after an adverse Supreme Court ruling”. The Conversation. https://theconversation.com/nevadas-unions-show-how-organized-labor-can-flourish-even-after-an-adverse-supreme-court-ruling-99067.
Terrell, Kenneth. 2020. “Unemployment’s Toll on Older Workers Is Worst in Half a Century”. AARP. https://www.aarp.org/work/working-at-50-plus/info-2020/pandemic-unemployment-older-workers.html.

