

May 30, 2019

Asian American and Pacific Islanders (AAPIs) are one of the fastest growing demographic groups in the US workforce. About 9.5 million AAPIs[1] ages 16 or older worked in the United States in 2017 — a dramatic increase from just over one-half of one percent of all US workers in 1960 to 6.1 percent today.[2] AAPI workers also almost doubled from 2000, during a period when the Asian population in the US grew 87 percent, from 11.9 million in 2000 to 22.2 million in 2017.[3]
As more AAPIs enter the labor force, it is becoming ever more important to understand the unique challenges facing these workers and not be misled by the model minority stereotypes that have consistently downplayed the socioeconomic disparities rampant in these communities.
Data have consistently shown[4] that income inequality in the US is greater among AAPI workers than it is among workers from other racial and ethnic groups. Figure 1 below shows the income of full-time and full-year wage and salary earners, at 10th, 50th, and 90th percentiles of the pay distribution, and demonstrates the gap between high- and low-wage workers.
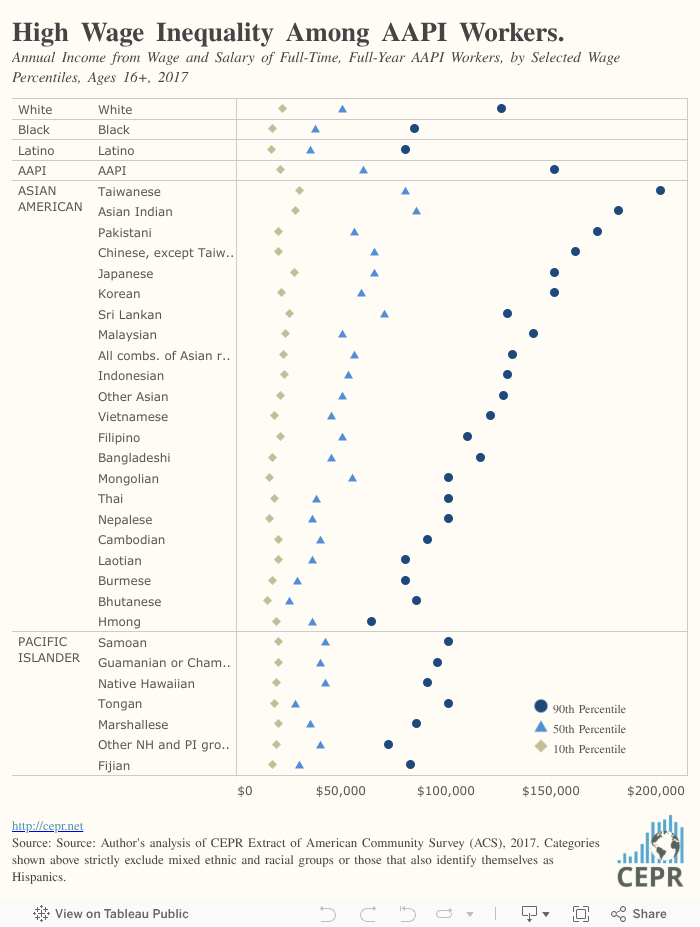
In 2017, AAPIs at the 90th percentile of the pay distribution (high-wage workers) made 7.1 times the pay of AAPIs at the 10th percentile of the distribution (low-wage workers). This wage gap was highest for AAPI workers, compared to about a 6-to-1 ratio for white workers, and about a 5-to-1 ratio for black or Latino workers. The 90/10 ratio was even higher for some ethnic AAPIs groups, such as Pakistani and Chinese (excluding Taiwanese), and similarly high for Korean, Bangladeshi, Vietnamese, Taiwanese, Asian Indian, Mongolian, Nepalese, and Malaysian groups.
While AAPIs in total made more than other racial and ethnic groups on average ($60,700 in 2017), this also varied significantly across different AAPI groups. For example, while Asian Indians earned $86,000 on average, Bhutanese earned just about $25,000 a year on average. High-wage Taiwanese workers earned $200,000 in 2017, while high-wage Koreans made $152,000 and Hmongs $65,000.
Pacific Islanders also generally earned lower wages than Asian Americans. Even though the income inequality among each Pacific Islander group tended to be lower than most Asian American groups, Pacific Islanders working full-time and full-year earned about $28,000 (Tongan) to $42,000 (Samoan) on average.
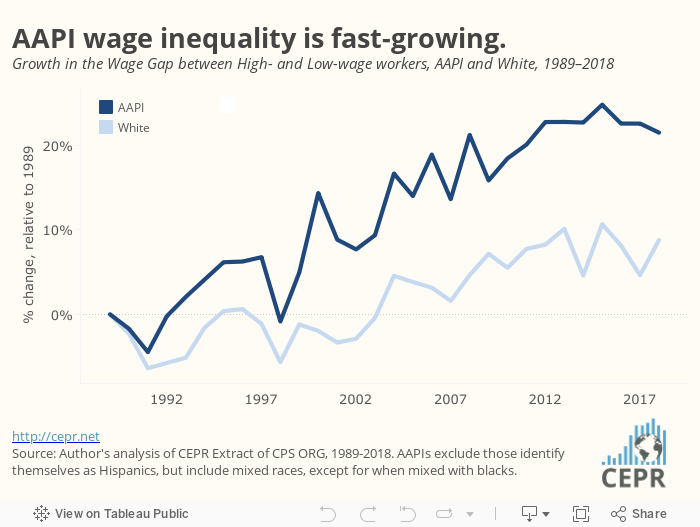
These disparities within and between Asian American and Pacific Islander subgroups are important to understand, given the continuing growth in the gap between high- and low-wage AAPI workers. Figure 2 shows changes in hourly wages of the 90th and the 10th percentile for AAPI and white workers from 1989 through 2018. In almost three decades, AAPI workers experienced nearly a 22 percent increase in wage inequality, while white workers experienced close to a 9 percent increase.
[1] Asian American and Pacific Islanders here exclude any individuals that also report Hispanic origin. Any mixed races with AAs or PIs are also excluded from this analysis. AAs do not include individuals that self-identify as PIs.
[2]Author’s analysis of CEPR extract of 1960 Decennial Census (PUMS) and 2017 American Community Survey (ACS)
[3]“The Asian Population: 2000”, Census Brief; “Asian-American and Pacific Islander Heritage Month: May 2019”, Census Newsroom.
[4]“Diversity and Change: Asian American and Pacific Islander Workers”, 2011, CEPR: https://cepr.net/documents/publications/aapi-2011-07.pdf; “Income Inequality in the U.S. Is Rising Most Rapidly Among Asians”, 2018, Pew Research Center: https://www.pewsocialtrends.org/2018/07/12/income-inequality-in-the-u-s-is-rising-most-rapidly-among-asians/.

