

April 04, 2017
Data from the Consumer Expenditure Survey show that the bottom 60 percent of the US population has been spending over 30 percent of their income on housing since before 1989. In 1981, the Department of Housing and Urban Development (HUD) issued a recommendation that a maximum of 30 percent of household spending go to housing costs. This clearly has not been the norm for most households over the last three decades.
For the lowest income quintile (with an average income of $10,916 in 2015), rising housing costs are an especially large burden, averaging over 40 percent of income spent on housing each year since 2007. At the other end of the income spectrum, the top income group (average income of $177,851 in 2015) spent more than recommended on housing for a majority of the years analyzed, although the most recent numbers are back below 30 percent.
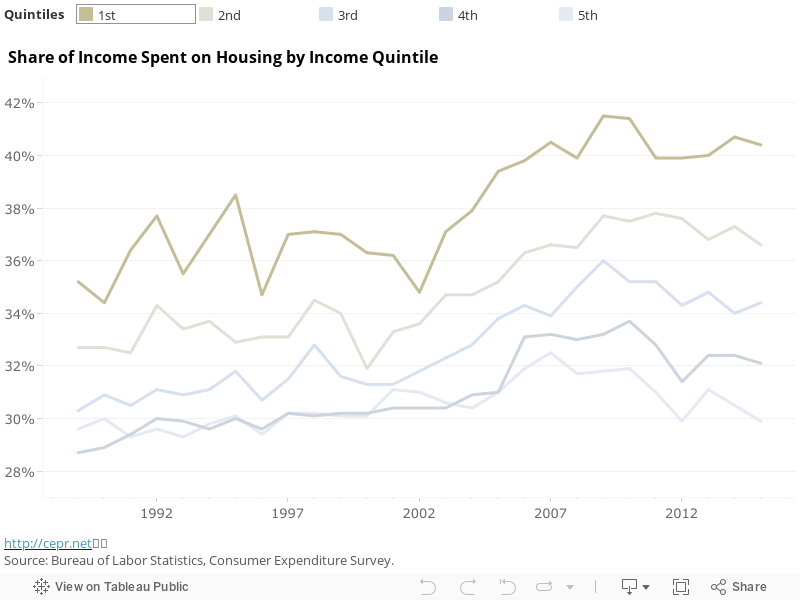
In 1989 the poorest 20 percent of consumers (with income below $19,572 in 2015 dollars) spent 35.2 percent of their income on housing; in 2015 they spent 40.4 percent. Housing expenditures for this group rose very rapidly from 2002 to 2007 and have not sunk to ‘90s levels since.
The dramatic increase in housing expenditure shares is even clearer for consumers of the second income quintile (those with incomes between $19,572 and $37,638 in 2015), whose spending is not quite as erratic. In 1989, these consumers spent 32.7 percent of their income on housing; in 2015 they averaged 36.6 percent. The majority of this 3.9 percentage point increase occurred between 2000 and 2009, during which the share increased 5.9 percentage points before falling to the most recent level. That 5.9 percentage point increase is also the largest jump of any income group over this period.
The third income quintile, with income between $37,638 and $62,587 in 2015, spent 34.4 percent of their income on housing in 2015. This is an increase of 4.1 percentage points, much of which occurred between 2000 and 2009. However, housing expenditure shares have decreased about 2 percentage points since 2009. Throughout this period, the middle quintile, which is unarguably middle class, spent well over the HUD’s recommended ceiling.
Those making between $62,587 and $103,057 in 2015 are in the fourth income quintile. Overall, their share spent on housing has risen 3.4 percentage points since 1989, crossing the 30 percent threshold in the late ‘90s. For this group the impact of the Great Recession is clearly visible in housing expenditures, which fell sharply from 2010 to 2012.
The highest income quintile, those making over $103,057 in 2015, spends the smallest share of its income on housing. Like other groups, it experienced a peak in housing expenditures, just before the recession. Unlike other groups, however, its housing expenditures have recovered to pre-2000 levels. In 1989, these consumers spent 29.6 percent of their income on housing; in 2015 they spent 29.9 percent. Even the early-2000s increase in this share amounted to less than 3 percentage points, which is smaller than the increase for any other group.

