

October 16, 2023

I am grateful to the Amalgamated Foundation for the generous funding of this study. This paper also would not exist without the help of Victoria Coan and Destinee Anderson in tracking down FAIR Plan information across every state. Stephen Jablonski, president of the Property Insurance Service Plans Office, and Paige Harper, general counsel at Louisiana Citizens, also helped with directing me to the correct data and providing context. Many thanks to Victoria, Algernon Austin, Eileen Appelbaum, Kelsey Moore, and Brandon Novick for helpful comments, formatting, and edits.
The National Flood Insurance Program and FAIR Plans share a common history and were created in response to insurance crises in the 1960s. Their goal is to cover homeowners and businesses in cases of disaster, but the NFIP was placed under the federal government’s control and the regulation of FAIR Plans was placed in the hands of states. Both, however, were not designed with climate change in mind. Now, after 55 years, the US faces more climate-related disasters, and both programs are struggling to handle the increasing claims. But the NFIP and FAIR Plans can learn from each other to adapt.
For the NFIP, the problem is low participation rates outside high-risk coastal areas. Claims from hurricanes and storms are causing the program to accumulate billions in debt to the US Treasury with interest payments that exceed investments in resilience. Forgiving the debt and changing borrowing terms could help the NFIP reduce costs, invest more in disaster mitigation, and expand community participation. FAIR Plans covering wind damage in hurricane or storm-prone areas also can require flood insurance as a requirement for other-peril coverage. This would ensure that homeowners in these areas are covered even if they fall outside the typical NFIP coverage zone.
For FAIR Plans, insurers are leaving the private market, sending more homeowners to the residual markets where the FAIR Plans reside. To avoid unstable situations for insurers and homeowners, states should focus on resilience and mitigation efforts, adjust premiums based on risk reduction, and consider lowering maximum coverage caps using median home prices at a more mezzo level, such as a county.
Climate-related disasters are a national problem, and policymakers at all levels of government need to take action to address insurance issues before they worsen. The proposed solutions in this paper are steps in the right direction.
In 2023, the US encountered a wide range of climate-related disasters. Wildfires devastated Maui, a tropical storm slammed low-lying desert communities in Southern California, record flooding in Vermont inundated the state’s capitol, and hurricanes battered the Gulf Coast and New England. As these types of disasters occur more frequently, the question of how catastrophe insurance providers can remain financially solvent in the face of increasing claims becomes more prominent. With more and more private insurers leaving high-risk markets, we may reach that tipping point sooner rather than later.
Thankfully, most homeowners can still obtain insurance to cover disasters. This type of insurance, which supplements basic property coverage, often covers “natural” disasters such as fires, floods, and earthquakes and can also cover robbery and vandalism. However, the existence of this insurance is not the result of market expansion. Insurers often have resisted getting into the business of what they consider high-risk policies. For homeowners in areas where they are most at risk of these perils, coverage is offered through catastrophe insurance programs either run by the federal government or through the residual market, which was created and, in some cases, run by the states.
The increase in access to catastrophe insurance resulted from government intervention in the private market, sometimes as a method to expand aid and other times as a method of dissuading potential homebuyers from living in hazardous areas. But one thing is clear: these avenues of coverage would not exist without the government.
However, the role of catastrophe insurance has changed from its inception. The most significant contributor to that transformation is climate change-related disasters. In the case of government-run flood insurance, the goal initially was to reform federal policies toward disaster aid by placing the responsibility of recovery on property holders. The resulting program, the National Flood Insurance Program (NFIP), has grown exponentially as federal disaster aid has become tied to insurance requirements. The NFIP held close to 5 million policies by the end of 2022 (Federal Insurance and Mitigation Administration 2022). In the case of the residual markets, the Fair Access to Insurance Requirements (FAIR) plans started as an act of Congress aimed at helping homeowners and businesses recover from the riots of the 1960s. These plans now cover people in areas at risk from wildfires, hurricanes, and windstorms.
The private insurance market still offers coverage in some at-risk regions. However, as the United States transitions to a period in which disasters have become a regular occurrence in communities across the country, people living in these areas are being pushed from the private market to these programs as more and more private insurers refuse to cover higher risks. The programs, some of which were only meant as providers of last resort, are now becoming large insurance providers. As a result, these programs face budget issues as the number of claims rises to match the increasing occurrence of disasters.
This paper examines catastrophe insurance provided by the federal government and through the residual markets from a historical context to show how their goals have shifted from their inception in 1968. The guiding questions include how the NFIP and FAIR Plans are similar and different, how risk has shifted, and whether the programs have adapted. Finally, I provide a snapshot of where they are now regarding solvency and market share. By following these programs from their inception to the present day, I aim to show how policymakers can learn from their differences and provide recommendations for adapting to a changing climate.
This paper is part literature review, part comparative analysis of the NFIP and FAIR Plans, and part analysis of current data on the programs’ financial statuses and insurance policy trends. I use publicly available data from FEMA and FAIR Plan data purchased from the Property Insurance Plan Service Office, a network of property insurance plans that publishes financial reports on state residual property insurance plans. Because all states have some sort of FAIR Plan, it is beyond the scope of this paper to conduct a comprehensive state-by-state analysis. Using FEMA disaster declaration data, I focus on states with the most declarations over the last ten years: California, Florida, Iowa, Kentucky, Louisiana, Mississippi, Texas, Washington state, and West Virginia.
Previous research has focused on the origin of the NFIP and FAIR plans, but they have yet to connect them. This oversight is interesting because both programs originated in 1968, when the Civil Rights Movement revealed the injustices Black Americans had suffered at the hands of government at all levels. These injustices included discriminatory housing practices in the form of single-family zoning and racial covenants that prevented black homeowners from entering white neighborhoods. These housing practices determined where black homeowners could and could not settle, and this issue primarily sparked two different insurance crises in the 60s. Looking at the programs in tandem highlights how Congress responded in two very different ways: one placed the risk of insuring property owners entirely on the federal government, and the other gave control of insurance decisions to states and associations of insurers authorized to conduct business in the states.
To understand these different responses, it is essential to give some historical context.
The NFIP’s history can be traced back to Hurricane Betsy, which once held the designation as the largest disaster to hit New Orleans in a century. Hurricane Betsy started as a tropical depression in the Atlantic Ocean on August 27, 1965. When it reached New Orleans on September 9, officials classified it as a category 4 storm. A report by the Army Corps of Engineers noted that based on the storm’s high speed and unusual course, the city only had 10 hours to prepare (1966, 7). The night the hurricane made landfall, three members of an emergency crew were sent to the levees along the Industrial Canal to sandbag a leak. The wind drove the crew away, and the floodwalls collapsed. Due to the lower elevation of parts of Orleans, Plaquemines, and St. Bernard parishes, water inundated the neighborhoods.
Hurricane Betsy was the first storm in the Atlantic to produce over $1 billion in damages, with destruction spread across several states (1966, 11). Survivors also had access to low-interest loans through the Small Business Administration, an option still currently available to disaster survivors.
Critics, however, warned that this type of government relief would lead to a scenario in which people would move into floodplains and rely on federal assistance in times of disaster (Kunreuther 1968, 134).
One of the leading critics, geographer Gilbert White, called for a mechanism that would deter people from living in floodplains rather than have them rely on the federal government’s relief and protection paradigm. From 1965-1966, White chaired a task force created by the then-US Bureau of the Budget to look at flood issues. The task force criticized the federal government’s attempts to control floods through engineering protection works, saying they “relieved many individual flood plain occupants of responsibility, in a fiscal sense, for the consequences of their actions” (1966, 2). The task force believed that if property holders in at-risk areas were required to pay annual charges in proportion to hazards threatening their property, the following would occur:
Congress had previously attempted to encourage private insurers to provide flood insurance with the Federal Flood Insurance Act of 1956, but the program was never implemented (Michel-Kerjan 2010). For insurers, it did not make financial sense to insure properties in high-risk areas. When Congress passed the Federal Flood Insurance Act of 1968, which created the NFIP, it was decided that providing flood insurance was a federal matter.
Upon its creation, the program had three goals: identify and map flood risks, encourage floodplain management, and provide insurance to those in floodplains. But since its inception, the program has relied on a voluntary partnership with communities to achieve these goals. Residents of participating communities are eligible to purchase insurance as long as the communities adopt minimum development regulations governing the 1 percent annual chance floodplains, also known as a 100-year floodplain. According to the fourth-quarter fiscal year 2022 watermark report on the NFIP’s financial data, 22,594 communities are participating in the program (Federal Insurance and Mitigation Administration 2022).
The NFIP conducts flood studies and mapping to identify 100-year floodplains, also known as Special Flood Hazard Areas. First, FEMA calculates a base flood elevation based on an engineering analysis considering flood risk, such as hydrologic and topographic studies. While floodplains are any flatland area at risk of inundation from floodwaters (Figure 1), FEMA assigns different designations based on the probability of an event occurring. The designation “100-year floodplain” means that the area has a 1-in-100 chance (1 percent) of seeing flooding equal to or exceeding the base flood elevation in a given year. A 500-year floodplain, on the other hand, has a 1 in 500 chance (0.2 percent) of inundation. A 500-year floodplain would be considered moderate-to-low risk compared with a 100-year floodplain, which is high risk.
Figure 1
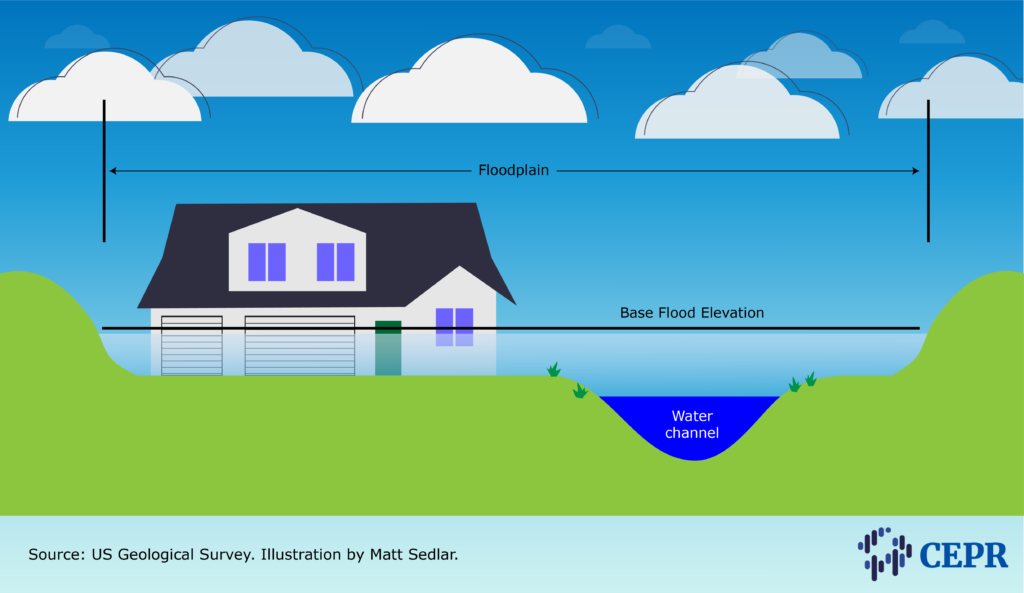
Maps of these 100-year floodplains, known as flood insurance rate maps, are crucial to the NFIP, as they determine everything from risk modeling and communication efforts to rules and requirements for homes located in the flood hazard area. The other goals of the program also hinge on the flood maps. But as we see later, the length of time that passes between updates to the maps can create problems for the program.
The NFIP incentivizes flood mitigation, and these incentives come in many different forms. First, FEMA provides minimum floodplain regulations that communities participating in the NFIP must adopt. While they vary by zone, they include the following:
Policyholders may receive premium reductions for measures such as elevating a property above base flood elevation. The cost of elevating a property can run anywhere between $10 and $35 per square foot, depending on the type of house, foundation, and height (Scott 2023).
FEMA also offers grants for mitigation through the Flood Mitigation Assistance Program as well as the Pre-Disaster Mitigation Grant Program, the Hazard Mitigation Grant Program, and the Building Resilient Infrastructure and Communities (BRIC) program. These programs fund community projects that range from protective measures for water and sewer systems to retrofitting transportation infrastructure to withstand disasters.
The overall goal of these projects is to reduce risk to property owners in floodplains and as a result, reduce premiums and claims. This brings us to the final goal of the NFIP: insuring property owners.
As stated previously, property owners living in participating communities have access to flood insurance through the NFIP. The idea was intended to transfer risk from property holders to the federal government while utilizing mitigation efforts detailed above to lower that risk. But the program had several issues when it was launched — the first is that it was intended to subsidize the cost of coverage for existing homes while charging actuarially fair rates on new development (Kousky 2018, 24). This loophole set up a pool of policyholders receiving significant savings on premiums as long as they maintain continuous coverage. As we will see later, the number of subsidized properties has strained operating expenses as risk has grown for grandfathered properties.
Another flaw with the NFIP’s launch was that, to critics’ dismay, the program initially lacked a coverage mandate, meaning homeowners in floodplains were not required to purchase insurance. Without this mechanism, there was nothing during the program’s launch to dissuade people from living in floodplains, as critics such as White envisioned. Language included in the Flood Disaster Protection Act of 1973 closed this loophole by establishing a requirement after March 2, 1974, that property owners in participating communities must purchase insurance to receive federal or federally related financial assistance to build or improve structures in a flood hazard area. The act also established insurance as a requirement to be eligible for disaster assistance for construction or reconstruction (The American Institutes for Research, The Pacific Institute for Research and Evaluation, and Deloitte & Touche LLP 2005). Purchasing coverage is still voluntary if a property is not located within a flood hazard area.
The NFIP was formed in 1968 in response to Hurricane Betsy, a disaster that at the time was very much an outlier but is commonplace today. Critics of how the federal government managed Betsy warned that relief efforts established an expectation that residents could rely on bailouts in cases of disasters, therefore encouraging further development in floodplains. The NFIP was proposed by federal flood management critics as a mechanism for discouraging new development and making living in floodplains prohibitively expensive. However, the version of the program that emerged from Congress softened some of those aspects. The same flood control measures that critics had maligned remained a policy goal of the program in the form of mitigation funding, and insurance was optional for the first couple of years of the program before becoming part of the requirements for federal financial and disaster assistance. If extreme weather events like Betsy had remained outliers, grandfathered rates likely would not have been an issue, but much like a river can change course over decades, so has the climate.
The NFIP obviously was not created with the future of climate change in mind, yet at least Congress’ attempt to address the problem could be seen as forward-thinking. Around the same time, another insurance crisis was emerging in the US, and the resultant policy solution by Congress and its current application toward climate-related disasters is even further removed from its original intention than the NFIP.
As Congress and the federal government were working on a program for managing floods, a similar conversation was occurring around insuring homeowners and business owners during the urban riots of the mid-1960s. To understand the riots, it is vital to understand the role of the Civil Rights Movement in the mid-50s and 60s. The movement secured many victories, including the Civil Rights Act of 1964, which made segregation in public facilities illegal and prohibited employment discrimination, and the Voting Rights Act of 1965, which outlawed literacy tests and poll taxes that prevented many black Americans from exercising their right to vote. But by the mid-1960s, the movement oscillated between “unrealistic hopes and more realistic despair” (Abu-Lughod 2012, 80), spurred by President Johnson’s failed “War on Poverty” and government suppression of protests against the Vietnam War. The war had superseded national interest in civil rights issues, and political and nonviolent channels of protest became less successful. Sit-ins were soon replaced with uprisings.
In the early 1960s, skirmishes occurred between protesters and police in the South. But dissatisfaction with the lack of progress and terrible conditions in urban neighborhoods soon expanded to other regions. According to the Kerner report by the National Advisory Commission on Civil Disorders, the 1965 Watts riot in Los Angeles was “the worst in the United States since the Detroit riot of 1943” (Governor’s Commission on the Los Angeles Riots 1965). But there was much more under the surface. Entire neighborhoods in Los Angeles had undergone population succession, with whites fleeing to the periphery, using deed restrictions, minimum size lot zoning, and racial covenants to keep blacks in South Central and Watts. On top of that, urban redevelopment and freeway construction cut into marginalized neighborhoods. Black residents of Los Angeles were trapped in deteriorating neighborhoods with no prospects of moving up. And it was not just Los Angeles undergoing these changes. In 1966 alone, there were 43 riots varying in intensity and length.
The situation created an insurance crisis for businesses and homeowners living in urban areas. By 1967, President Johnson formed the National Advisory Panel of Insurance in Riot-Affected Areas to study the issue. The panel produced a report that argued insurance was essential to revitalizing urban cores, calling it the “cornerstone of credit” (President’s National Advisory Panel on Insurance in Riot-Affected Areas 1968, 1). Banks and other financial institutions cannot make loans without insurance. Housing development projects cannot move forward, and repairs cannot be made to existing housing. Businesses cannot launch or expand. When insurance is unavailable, buildings are neglected, and services, goods, and jobs disappear.
But when the panel surveyed approximately 1,500 homeowners and 1,500 business owners in high-poverty areas of Boston, Cleveland, Detroit, Newark, Oakland, and St. Louis, it found 35 percent of business owners and over 50 percent of homeowners said that insurance was unavailable and almost 30 percent of both categories said insurance was too expensive.
The panel, in examining the factors underlying the unavailability, found not only that the insurance industry determined urban areas to be unprofitable but that it actively dissuaded agents from submitting too many applications from areas that were “too risky” (1968, 5).
Underwriting materials submitted to the panel revealed that businesses were restricted in certain geographic territories. One guide suggested that agents consider the following situations when submitting applications for coverage:
According to the guide, “A good way to keep this information available and up to date is by the use of a red line around the questionable areas on territorial maps centrally located in the underwriting division for ease of reference by all underwriting personnel” (1968, 6).
The panel argued that such procedures were discriminatory when applied generally, concluding “applications for insurance must be considered on their individual merits if everyone is to have fair access to insurance” (1968, 8) to be justified. Under the panel’s recommendations, the federal intervention would be limited.
The panel’s recommendations form the basis for FAIR Plans, which Congress authorized with the Urban Property Insurance and Reinsurance Act of 1968.
In their most basic form, FAIR Plans provide what the acronym promises: fair access to insurance. The plans do this through a unique partnership between industry, states, and the federal government, allowing property owners who cannot acquire insurance through the private market an opportunity to purchase a policy on what is called the residual market. How do they do this? FAIR Plans operate as insurance pools “administered under the insurance authority in each state or authorized by state law” (Dwyer 1978, 622). Insurance companies participate in these pools by writing higher-risk policies according to the proportionate share of property insurance they voluntarily underwrite in the state. These plans assure every property owner a right to inspection and written notice of any improvements or loss prevention measures required to make their property insurable. The plans provide insurance if properties are maintained according to insurance standards. All these assurances apply to dwellings and commercial risks for fire and extended coverage (wind, hail, explosion, riot, civil commotion, aircraft, vehicle, and smoke); vandalism and malicious mischief; and burglary and theft.
To date, all states have some form of FAIR Plan association. Except for Florida and Louisiana, it is inaccurate to state that FAIR Plans are state-run, but states play a large role in regulating them. The types of coverage offered by such plans, the amount of coverage permitted under such plans, and the criteria by which a person or piece of property will be eligible for such plans are all subject to variations in state regulation of FAIR Plans. Furthermore, FAIR plan rules are continuously susceptible to change, even within a single state (Office of the Assistant Secretary for Fair Housing and Equal Opportunity, HUD 2016).
As stated before, the federal government’s involvement is minimal. The federal guidelines dictating how plans operate are broad enough that cooperating states can create variations of the program. However, there are 10 minimum federally imposed criteria:
The federal government’s role was to motivate insurers to participate by providing riot reinsurance through the Federal Insurance Administration within the Department of Housing and Urban Development (HUD). Reinsurance serves as a protection for insurers when reinsured losses paid are greater than the total reinsurance premiums received. This scenario occurs in the case of an unprecedented disaster, such as the Watts riots. Reinsurance funds come from reinsurance premiums or, in the case of massive losses, the borrowing power of the U.S. Treasury. But for FAIR Plans, this reinsurance was only available for the following: (1) fire and extended coverage; (2) vandalism and malicious mischief; (3) other allied lines of fire insurance; (4) burglary and theft; and (5) portions of multiple peril policies similar to the aforementioned coverages (Moore 1978).
To address this problem, Rep. Elizabeth Holtzman (D-NY) sponsored an amendment, which became law on October 31, 1978, to the Urban Property Insurance and Reinsurance Act (Webel 2019).
With riots no longer a pressing issue in urban cities, it is not unreasonable to expect the FAIR Plan market to shrink. After all, FAIR Plans often refer to themselves as “insurers of last-resort,” a Band-Aid until property owners can acquire a policy on the private market. And for a while, that is what happened. In 1990, there were only 781,188 policies in force in the United States (Property Insurance Plans Service Office 1980). But since climate-related disasters have increased in the US, the number of policies has risen dramatically. And as we see later, this has affected the residual market in a way the creators of the FAIR Plans could not have predicted.
Congress and the federal government’s attempt to address the insurance crisis resulting from racist post-WWII housing policies and the urban riots of the mid-1960s took a different route than the NFIP. With FAIR Plans, which grant property owners who cannot acquire insurance through the private market access to the residual market, the burden fell mostly on the states and the insurance industry. The main role of the federal government, the federal riot reinsurance system, originally encouraged states to participate but eventually fell by the wayside as riots became less of a concern in cities.
Much like the NFIP, FAIR Plan policies have had to adapt to a changing climate, although the FAIR Plan transition has been more extreme, shifting from coverage that was meant to address damage from riots to climate-related disasters. The next section is a comparative analysis of the two programs, looking at other ways in which they work.
This section will evaluate and compare the two different programs based on the following criteria: administration of the programs, the purpose of the programs, and the cost for consumers.
As noted before, the NFIP is run by the federal government, specifically FEMA. Congress has not provided a long-term renewal for the program since 2017 but has regularly approved short-term reauthorizations (Horn 2019).
Consumers seeking to obtain flood insurance have two options. The first option is to purchase directly through FEMA via an insurance agent or broker. If a qualified consumer cannot obtain insurance through the private market or other methods, the agency manages its own insurance firm that serves as an insurer of last resort. Called NFIP Direct, the company services standard flood insurance policies as well as repetitive loss and group policies (U.S. Government Accountability Office 2009; Valdivia 2017).
The second option for purchasing a policy is through private insurance firms. The federal government has relied on insurers since the beginning of the NFIP to sell and maintain policies. From 1969 to 1977, NFIP policies were handled through the National Flood Insurers Association, a consortium of insurers not unlike a FAIR Plan association. Then from 1978 to 1983, NFIP policies were handled by a federal contractor. But in 1983, FEMA created the Write-Your-Own (WYO) insurance program.
The WYO program aims to build the NFIP policy base, diversify the geographic distribution of policies, improve customer service, and provide the insurance industry with experience maintaining flood insurance (U.S. Government Accountability Office 2009). To do this, private insurance companies, or WYOs, act as brokers for FEMA. Most importantly, WYOs do not share risks regarding NFIP claims. WYOs issue policies, collect premiums, subtract commission and other costs from the premiums, and then send the remaining amount to the NFIP. When a claim is filed, the WYOs handle the claim like any other insurer but then later receive reimbursement through the National Flood Insurance Fund.
But the WYO arrangement states WYOs “must investigate, adjust, settle, and defend all claims or losses arising from policies” (Malecki 2000). While WYOs do not cover the costs of NFIP claims, they face risks in handling those claims at the state level. This risk has impacted WYOs involvement in the program.
There are currently 47 companies participating in the WYO program (Schuppe 2022; Flavelle, Cowan, and Penn 2023). The regular occurrence of costly climate-related disasters is putting the administration of NFIP policies in a precarious spot. When a WYO leaves the program, the policies are transferred to NFIP Direct, putting more of the burden of managing claims directly on FEMA.
The administration of FAIR Plans is far more complicated. Unlike the NFIP, which is organized top-down by the federal government with private market insurers acting as intermediaries, most FAIR Plans are associations consisting of a pool of insurers with state governments granted the powers to protect consumers. This section can only provide broad strokes since all states and Washington, D.C., offer FAIR Plans. Of all states with FAIR Plans, only two — Florida and Louisiana — are state-run. For all other states, insurance is offered through an association of insurers, with participating companies often writing policies based on the proportion of property coverage they provide in the state. FAIR Plans are financially supported by these companies, with each insurer sharing FAIR Plan revenues, losses, and costs. This structure spreads out the risk associated with the most high-risk policies so that not one company is on the hook for a massive claim. Typically, a board of directors governs the associations.
On the state side, a state insurance commissioner regulates FAIR Plan associations. While a state insurance commissioner’s responsibilities may vary from state to state, they are generally charged with regulating the industry and acting as a consumer protection advocate.
State insurance commissioners can act as checks on FAIR Plan associations. For example, current California Insurance Commissioner Ricardo Lara has held investigatory hearings into the California FAIR Plan Association “to gather evidence and ascertain the facts regarding operations, policies, and procedures … to inform actions needed for it to evolve to meet the changing needs of California consumers” (Alabama Insurance Underwriting Association 2021; Louisiana Citizens Property Insurance Corporation 2015; Virginia Property Insurance Association 2005).
As previously stated, Florida and Louisiana’s FAIR Plans are wholly state-run. In 2002, the Florida Legislature established the Citizens Property Insurance Corporation. Citizens is a non-profit government agency entrusted with providing property insurance to eligible property owners who cannot obtain insurance on the open market. Citizens is funded by policyholder premiums, and in the event of a deficit, Citizens can levy assessments on policyholders. Citizens is managed by a board of governors, which develops a plan of operation that must be approved by a panel of state officials (Citizens Property Insurance Corporation 2013). Citizens must also follow the statutory restrictions set by the state legislature.
Similar to Citizens, the Louisiana Citizens Property Insurance Corporation, created in 2003, is a nonprofit tasked with providing business and residential property insurance for property owners unable to obtain insurance on the private market. Louisiana’s Citizens also is managed by a board of governors, which creates a plan of operation that must be approved by the state legislature (Louisiana State Legislature 2013; Louisiana Department of Insurance 2016).
As stated previously, unlike the NFIP, the federal government has little to no involvement with FAIR Plans. Agencies such as the Federal Insurance Office (FIO), housed under Treasury, and the National Association of Insurance Commissioners (NAIC), created and governed by regulators from US states and territories, play a role in insurance regulation and consumer protection. The FIO and NAIC may provide recommendations and regulatory oversight to ensure that industry-wide practices are fair and equitable. They may also work with state insurance regulators to address insurance market difficulties and how to increase consumer access to insurance. However, their involvement in FAIR Plans is limited, with the industry and state playing the largest role in their functions.
In terms of purpose, the most obvious difference between the two programs is that the NFIP focuses entirely on flood insurance, mapping, and mitigation. The program not only has the goal of providing insurance but preventing future disasters.
The FAIR Plans focus on various perils, such as fires/lightning, windstorms/hail, explosions, riots, smoke, volcanic eruption, vandalism, theft, structure collapse, and freezing. But mitigation efforts are not always built into the plans, and in fact, some insurance commissioners and legislatures have argued or mandated that FAIR Plan insurers take mitigation efforts into account when establishing premiums (Frith 2017; Lara 2023). California, for example, has established requirements through its “Safer from Wildfires” framework that insurers must take into account mitigation efforts when setting rates.
Where NFIP and FAIR Plans differ significantly is their goals in managing policies in force. While the initial goal of critics in forming the NFIP was to place the burden of responsibility on property holders and discourage people from living in at-risk areas, the goal of NFIP’s WYO program, as stated previously, is to increase policies in force. The NFIP has also created targeted marketing initiatives to reach new customers in high-risk areas and encourage existing customers to renew their policies (National Flood Insurance Program 2018). The advantage of the NFIP holding more policies is that it can spread risk across a larger pool of customers and the program’s fund has more in reserves in the case of massive losses. The number of policies in force also has the potential to decrease premiums; although there are many other variables to consider. By being the first option in flood insurance, the NFIP can potentially bring down overall costs if take-up rates, the percentage of households with policies, are high.
But calling the NFIP a “national” program is a misnomer, as the number of policies in force spans only a handful of states (Table 1). And this trend is not a case in which the only states with policies are the only states with flooding. Climate change has caused heavier rainfall events, which have led to larger and more frequent floods in rivers and streams across the Northeast, Midwest, Pacific Northwest, and northern Great Plains (Environmental Protection Agency 2016). One way for NFIP to bring down costs is to expand to other states.
| State | Percent |
|---|---|
| Florida | 36.1% |
| Texas | 14.4% |
| Louisiana | 9.9% |
| New Jersey | 4.4% |
| South Carolina | 4.3% |
| California | 4.1% |
| New York | 3.5% |
| North Carolina | 2.8% |
| Virginia | 2.0% |
| Georgia | 1.6% |
Source: Federal Emergency Management Agency, Policy Information by State, 7/31/2023.
While NFIP is angling to become the “market of first resort,” FAIR Plans have taken the opposite tactic. FAIR Plan policies are meant to be a Band-Aid until property owners can secure insurance through the private market or relocate. Some states have used legislation and regulations to expedite that process. For example, Louisiana has mandated that policies through Louisiana Citizens are more expensive than policies offered through private property insurance companies. According to Louisiana law, Citizens’ rate in each parish must be “at least 10 percent over the highest qualifying market rate or 10 percent over the actuarial rate, whichever is higher” (Finch II and Cranney 2022). These policies then revert back to Citizens.
California is an example of a state taking the opposite actions of Louisiana, and that was the result of efforts in the 1980s by Ralph Nader. The long-time consumer advocate backed Proposition 103 in the 1988 state election, which led to sweeping changes in how insurance rates are set in the state. Proposition 103 mandates that insurance companies obtain “prior approval” from the California Department of Insurance, with the assistance of consumer “intervenors,” before implementing property and casualty insurance rates. Before Proposition 103, insurance firms established vehicle, property, and casualty insurance premiums without the Insurance Commissioner’s approval. Another effect of Proposition 103 was that insurers were required to roll back their rates by 20 percent (California Department of Insurance 2013).
Florida has a similar state law that limits how much Citizens can raise rates year to year, and Citizens must get approval from the state’s Office of Insurance Regulation for rate increases (Kaenel 2023).
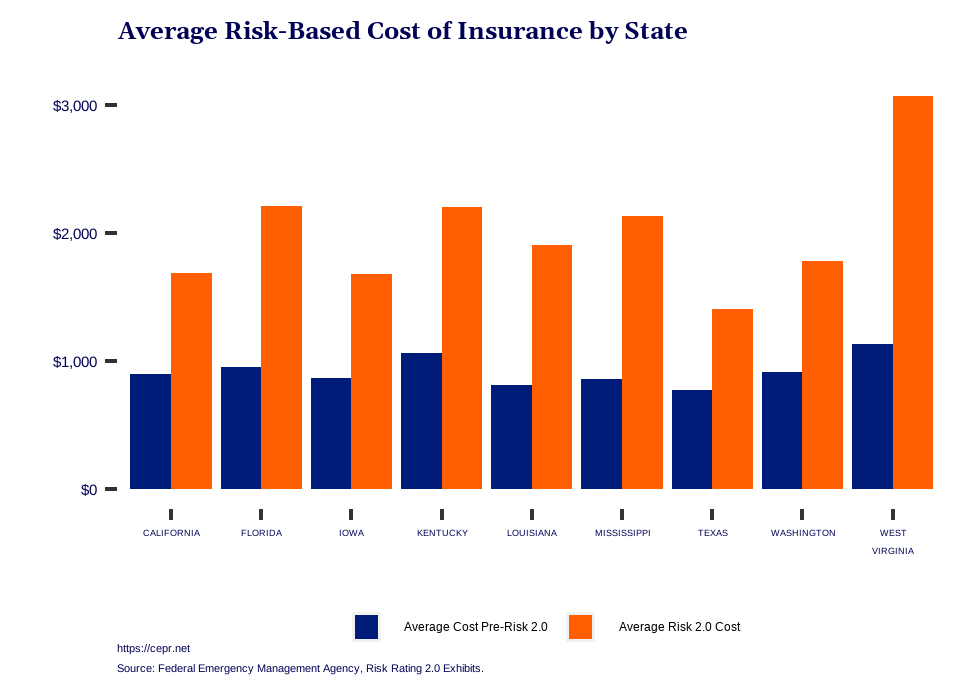
From the 1970s up until recently, NFIP rates were mostly based on relatively static measures, stressing a property’s elevation inside zones on a FIRM. In 2021, however, FEMA announced that the NFIP would switch to a new pricing methodology called Risk Rating 2.0 (Federal Emergency Management Agency 2021). The new process is intended to be more precise and equitable than the previous system, which relied on out-of-date flood maps.
Instead of relying solely on flood maps, Risk Rating 2.0 considers several elements, including the property’s distance to a water source, its elevation, and the cost of rebuilding. The new system is projected to result in more accurate premiums for all policyholders (Carrier Management 2021; Williams et al. 2023).
The NFIP’s own data from single-family policies renewed before Sept. 30, 2022, shows this effect (Figure 2). Cost increases due to Risk Rating 2.0 changes vary from an average 81 percent increase in Texas to an average 171 percent increase in West Virginia.
Figure 2
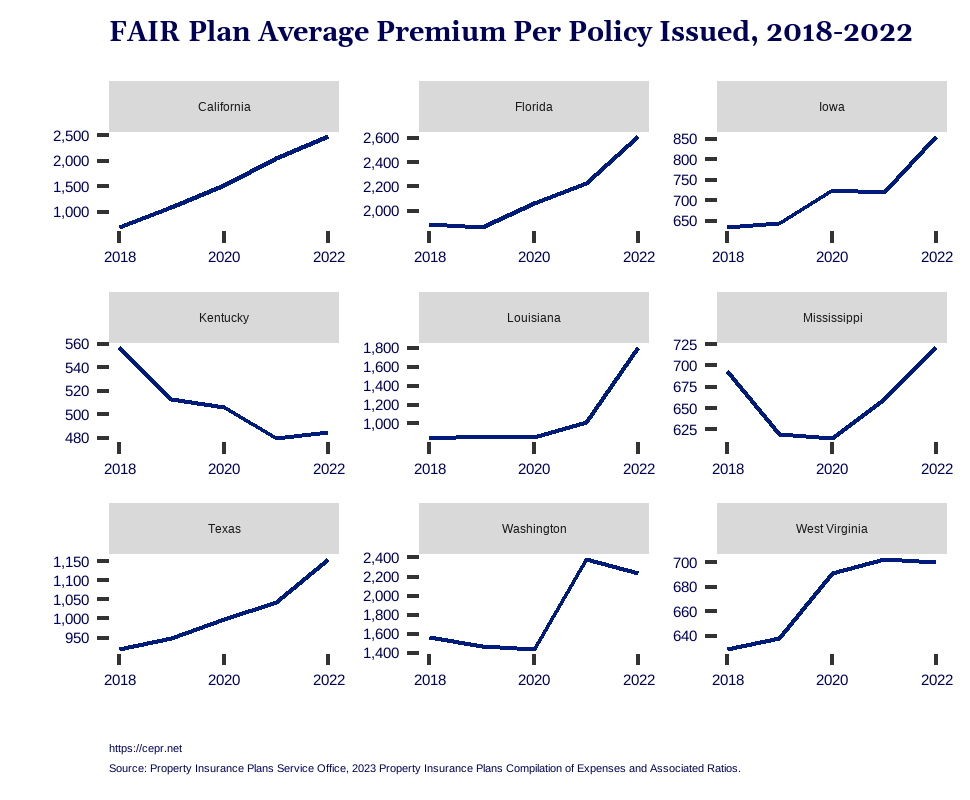
FAIR Plan premiums have risen over the last five years (Figure 3). In California, premiums rose by 252 percent between 2018 and 2022, and in Louisiana, they rose 113 percent during the same period. The outlier is Kentucky, where premiums have decreased 13 percent. A similar pattern can be found in Mississippi, but premiums recently have increased. More research is necessary to understand trends in that state.
Figure 3
So what do these policies cover for the increasing cost to consumers? The NFIP provides a range of coverage options, but the maximum amount of coverage for residential properties is $250,000 and a $100,000 coverage cap for personal property (National Flood Insurance Program 2020a). This means that the NFIP will only cover up to $250,000 of the cost of repairing or rebuilding a house that has been destroyed by flooding and up to $100,000 for anything inside the house. Building and content coverages, however, must be purchased separately, and a private insurer must provide supplementary flood insurance if the house is worth more than $250,000.
Other restrictions imposed by the NFIP include a 30-day waiting period before coverage kicks in; although the program provides exceptions if homeowners meet certain qualifications.
Residential coverage through the FAIR Plans obviously varies by state. In California, for example, the maximum amount of coverage is $3 million for a combined dwelling policy. Florida’s maximum amount is $700K per structure, with cap set at $1 million in Monroe and Miami-Dade counties, and 50 percent of the building value for contents. Louisiana and Texas both cover $1 million dwelling and $500K for contents (Kentucky FAIR Plan Reinsurance Association 2021).
For a breakdown of FAIR Plan coverage by state, see Appendix A.
Table 2 breaks down the comparative analysis between the programs.
| Program | Coverage | Government funded/affiliated | Cost | Maximum coverage |
|---|---|---|---|---|
| National Flood Insurance Program | Flood | Yes; housed within the Federal Emergency Management Agency (FEMA) | Varies by state | $250,000 dwelling limit, Up to $100K for contents |
| FAIR Plans | Various single-peril coverage | Yes and no; enacted under Federal guidelines and created by state governments but operate as associations of all insurers licensed to write property insurance in a state. Florida and Louisiana FAIR Plans, however, are state-run. | Varies by state | See Appendix A. |
This section creates a snapshot of the programs using the most recent data available.
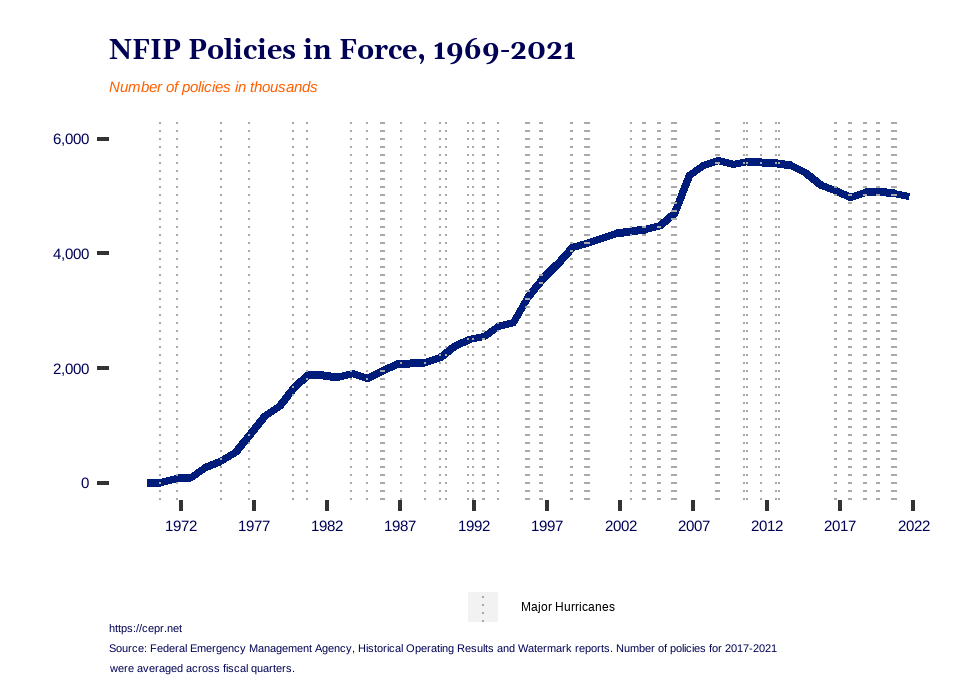
From the NFIP’s implementation in 1968 to 2021, the number of policies in force has increased by about 907 percent (Figure 4). In the past few decades, however, the number of policies has been on a slow decline. Research has found the number of policies bump up after disasters because of the requirement that recipients of disaster aid purchase flood insurance. A couple of years after the disaster, the number of policies reverts to its original level (Atreya, Ferreira, and Michel-Kerjan 2015; Browne and Hoyt 2000; Gallagher 2014; Kousky 2018). This trend appears in Figure 4, with the dashed lines representing hurricanes that were declared “Major Disasters” by FEMA. For example, there was a large increase in policies after Hurricane Katrina in 2005. It is likely that most recent disasters like Hurricane Idalia may result in a temporary increase in take-up rates.
Figure 4
Take-up rates are an important variable in assessing the efficacy of the NFIP. They are a measurement of how many eligible homeowners — those who live in flood hazard areas — actually carry policies. Estimates of take-up rates vary. Data show that 99 coastal counties in the US held 75 percent of all residential NFIP policies in 2018 (Kousky et al. 2018).
It is tempting to say that take-up rates are low in some states because they are not at risk from hurricanes or tropical storms. But despite their dry climate, states such as Utah, Nevada, and Arizona also experience floods. Flash flooding can occur in these states because the rocky terrain in these states does not have enough soil or vegetation to absorb heavy rains. According to the US Geological Survey, the most common type of flooding, however, is river flooding. This type of flooding occurs in wetter climates, particularly in areas adjacent to large rivers. Excessive runoff from climate-related heavy rainfall can cause a slow rise in water levels over a larger area (US Geological Survey 2022).
So why are take-up rates low? One major reason is that flooding is still viewed publicly as mainly a coastal issue. Inland homeowners can be unaware of the risk of river flooding, and often states lack disclosure laws that mandate homebuyers are made aware of past flooding. Coastal residents, however, are much more aware of the threat of hurricanes and coastal flooding.
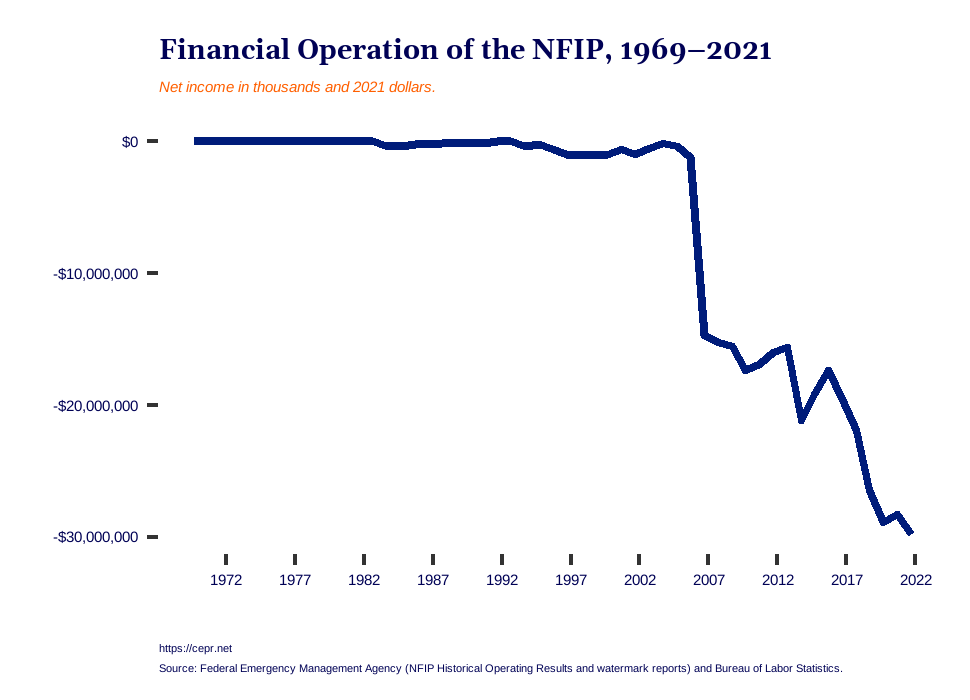
The NFIP’s future depends on expanding the number of participating communities, but the program’s financial situation is uncertain. The NFIP owed the Treasury $20.5 billion at the end of 2022, with interest totaling $300 million for the year. That number equals almost $1 million in daily interest (Federal Insurance and Mitigation Administration 2022; Horn 2022).
Figure 5
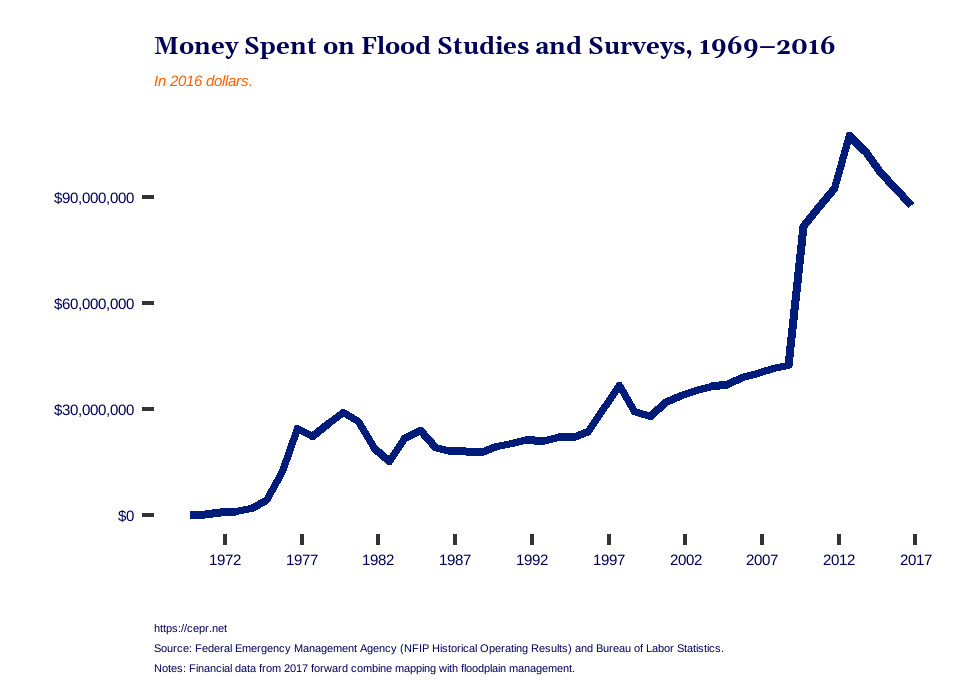
With flood maps being crucial to the program’s ability to identify and manage floodplains, spending on mapping activities should be one of the top priorities. But the NFIP’s maps are notoriously outdated due to budget constraints and the aforementioned amount of debt the program faces.
The Biggert-Waters Flood Insurance Reform Act of 2012 requires flood maps to be updated regularly and show 100-year and 500-year floodplains. The law authorized $400M in funding, but as Figure 6 shows, money spent on mapping activities peaked in 2012 at $116M and then declined. Financial data from 2017 up to 2022 combines mapping and floodplain management activities, making it difficult to know how much of the budget has gone toward mapping during that time period.
Figure 6
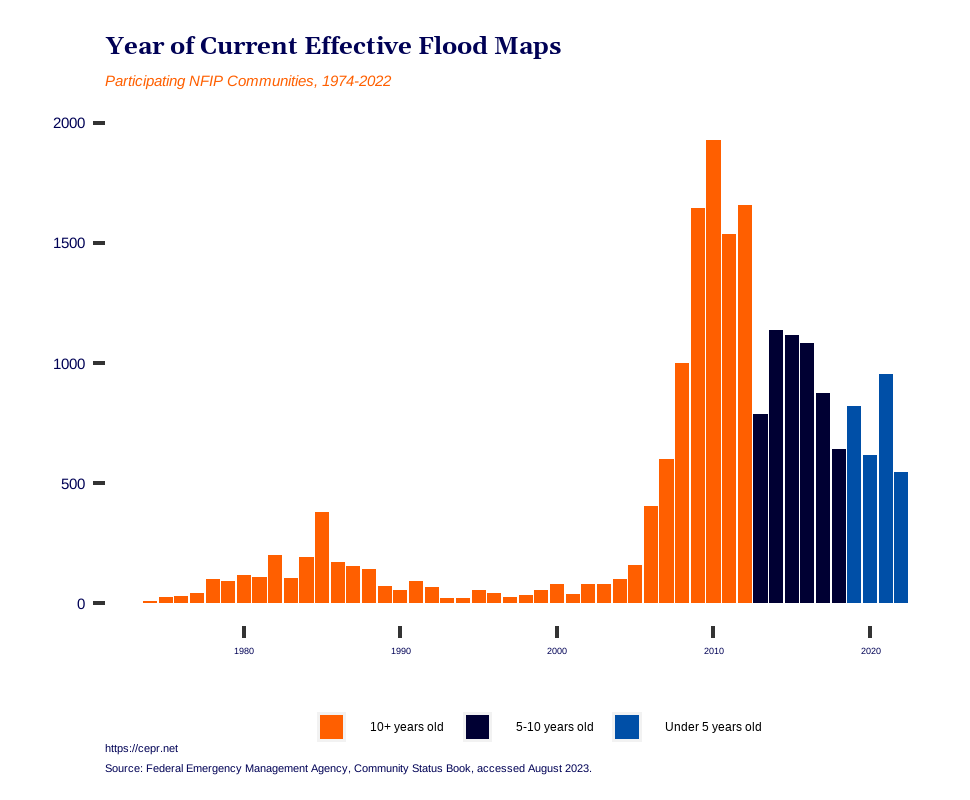
Data provided by FEMA’s Community Status Book, however, shows that 58 percent of flood maps in participating NFIP communities are over 10 years old, with some dating back to the 1970s and 1980s (Figure 7). The data also show 28 percent are between 5-10 years old, and only 14 percent are under five years old. Every five years, FEMA must examine a participating community’s flood maps. After that, the agency must decide whether to update or amend them. But with 22,594 communities participating in the program (Federal Insurance and Mitigation Administration 2022) and a long process for documenting and reviewing map changes, a backlog surely exists. If the program is to grow, it will be logistically even more difficult to manage flood mapping.
Figure 7
The current state of the NFIP shows it lacks the resources to continue functioning in a way that best serves homeowners in floodplains. The new Risk Rating 2.0 methodology, which reflects actuarial rates, is necessary to keep the program out of the red, but without more participating communities and a larger insurance pool, premiums will remain high. The program cannot communicate risks and identify more communities needing coverage if flood maps are not updated faster to identify constantly shifting 1-in-100-year floodplains.
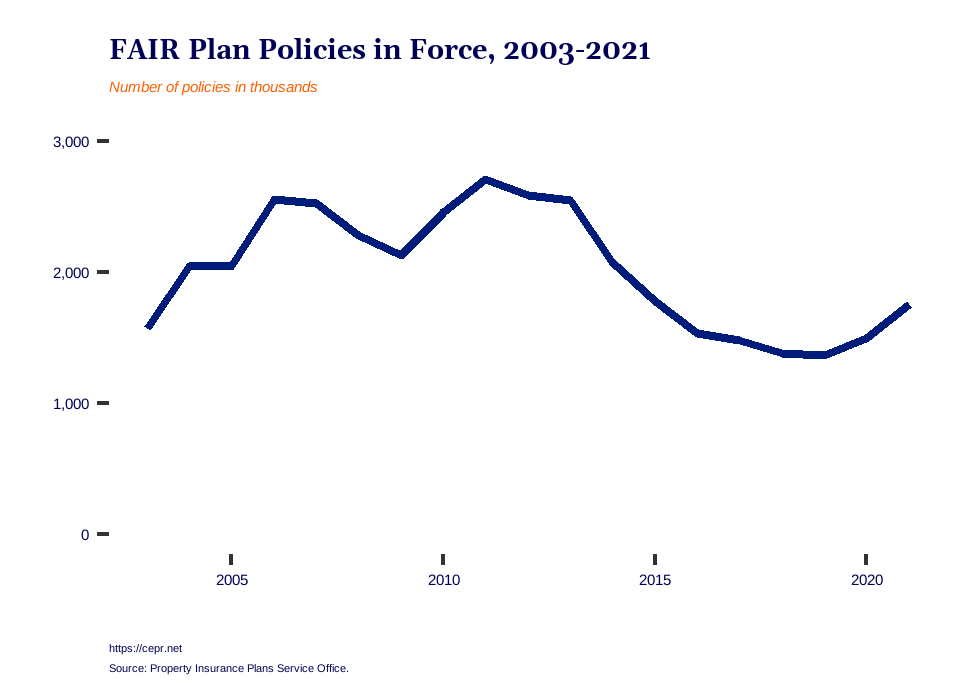
The total FAIR Plan policies in force between 2003-2021 show an interesting pattern, with the number of policies declining in 2014 and then rising back to 2003 levels (Figure 8).
Figure 8
Breaking down the data by states shows that policies declined in many states but not everywhere (Figure 9). California, for example, experienced a 113 percent jump in the number of policies issued between 2012 and 2021. For some of the remaining states, depopulation, both the demographic and insurance kinds, has played a role. Between the 2010 and 2020 censuses, the population of West Virginia decreased by 3.2 percent, or about 59,000 people — enough to lose a Congressional seat. This is the largest percentage decrease of any state in the United States. Numerous elements, such as declining jobs in the coal industry, an aging population, and the high rate of out-migration due to a lack of opportunities, have contributed to this reduction (Newsom 2022).
Figure 9
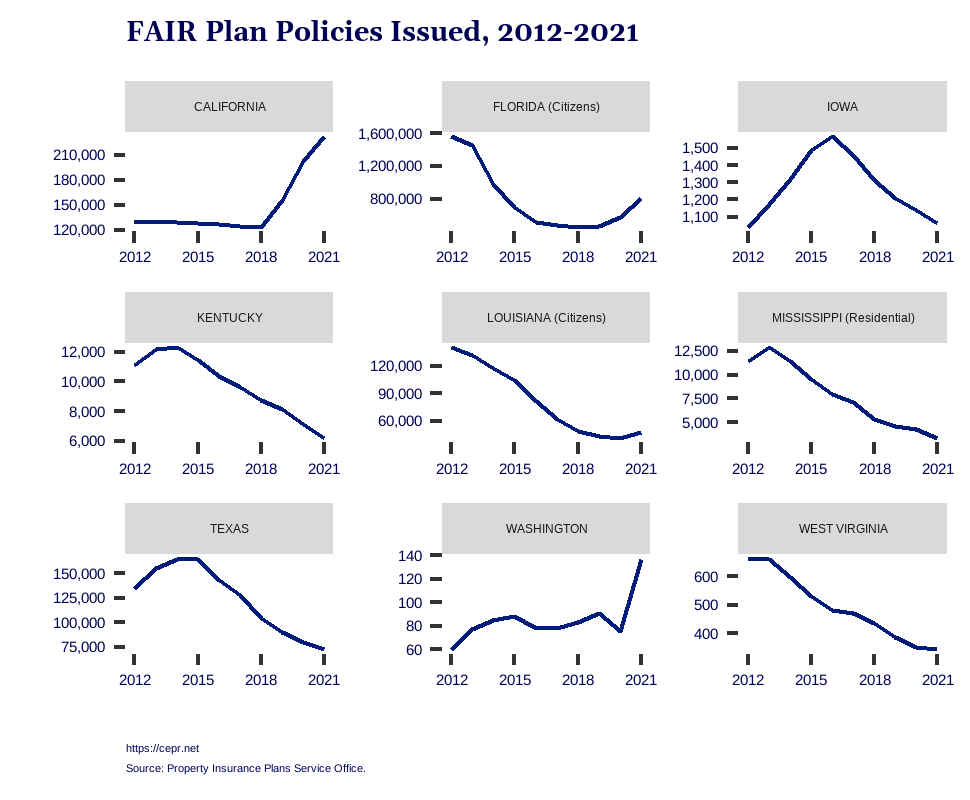
For the state-owned plans, Florida (Citizens) and Louisiana (Citizens), the drop in policies has partly been through the depopulation process mentioned previously. Florida removed over 866,000 policies between 2014 and 2022, though the majority of policies removed were in the first two years and the pace has slowed in recent years. For Louisiana, that number was far smaller, with 39,369 policies (Table 3). The majority of policies removed in Louisiana occurred within the first four years, 2014-2017, with the pace slowing in recent years.
| Florida | Louisiana | |||
| Year | Number of Policies | Exposure | Number of Policies | Exposure* |
| 2014 | 416,623 | $117,530,082,371 | 8,962 | $2,318,008,557.00 |
| 2015 | 272,785 | $64,830,051,559 | 10,827 | $2,471,366,706.00 |
| 2016 | 88,000 | $23,362,914,453 | 8,984 | $2,070,809,923.00 |
| 2017 | 34,008 | $7,435,411,434 | 7,067 | $1,875,462,894.00 |
| 2018 | 17,905 | $4,307,930,768 | 28 | $6,914,980.00 |
| 2019 | 10,084 | $2,180,766,592 | 89 | $18,061,920.00 |
| 2020 | 7,463 | $2,497,401,410 | 66 | $18,230,850.00 |
| 2021 | 2,814 | $1,027,251,879 | NA** | NA |
| 2022 | 16,408 | $7,173,925,259 | 3,346 | $686,197,850.00 |
Source: Florida Citizens, Exposure Removed 2014-2022, and Louisiana Citizens records request of Assumed Policies and TIV, accessed September 13, 2023.
*Total insurable value based on assumption of number of policies remove, not actual.
** LCPIC Board voted not to complete this round.
Though the purpose of the depopulation process is to remove exposure to losses, Florida and Louisiana are still in the red (Figure 10). These losses can be tied to major disasters that have occurred. For California, these disasters were the 2018 Camp Fire and subsequent major fires in 2020 and 2021. According to risk assessment company Milliman Inc., the Camp Fire and subsequent fires in 2017 and 2018 lost the California insurance industry “more than a quarter-century of underwriting profits.” (Beven II, Hagen, and Berg 2022; Krueger 2021). This pattern likely follows for other states in Figure 10.
Figure 10
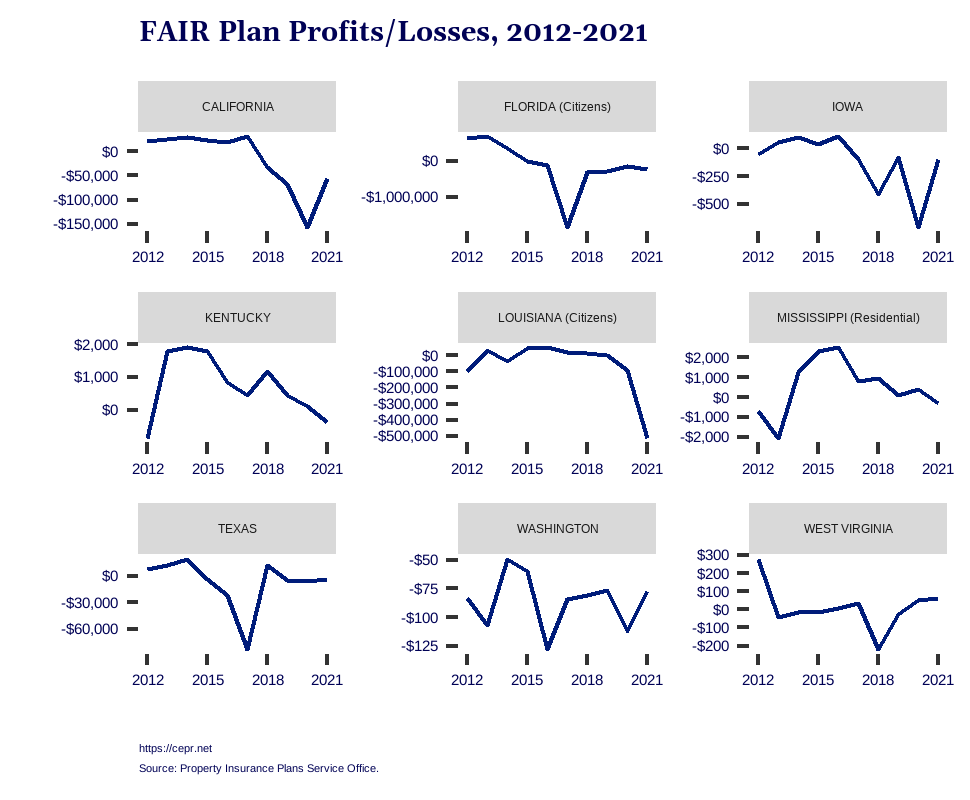
These large-scale disasters and the subsequent hit to insurers are why private insurers such as State Farm, AAA, Farmers Insurance, and All State have announced they will no longer sell policies in states such as California, Florida, and Louisiana. FAIR Plans were not designed to be a long-term solution, but for the foreseeable future, they are the only alternative for homeowners as the market pulls away.
The NFIP faces the dual issues of not having enough participating communities to lower the overall financial risk to the program and too much debt to finance projects, such as enhancing and expanding flood mapping, that would bring down costs. FAIR Plans, on the other hand, are seeing an increasing number of policyholders but without the backing of the US Treasury, face a greater risk of financial collapse in the event of multiple large-scale disasters. And the types of mitigation projects necessary to reduce risk to homeowners in hazardous areas rely on FEMA grants.
So what can be done to bring these programs into a future where climate-related disasters are the new normal? The next section proposes some potential solutions.
The first step is for politicians to prioritize the safety of their constituents. Without political will, nothing in this section can be accomplished. First, this means putting long-term funding in place for the NFIP instead of constantly reauthorizing the program through continuing resolutions. Millions of homeowners across the US should not have to worry that their homes are also at risk due to political threats of a government shutdown.
Ideally, any long-term support from Congress should include funding to replenish FEMA’s Disaster Relief Fund as well as increasing funds for the Hazard Mitigation Grant, Flood Mitigation Assistance, and Building Resilient Infrastructure and Communities (BRIC) programs. This does not imply writing a blank check to FEMA. The agency has been heavily criticized, both internally and externally, for how it distributes aid and grants. Grant application assistance for small communities and underprivileged individuals should be a prerequisite for funding.
Congress also has the ability to forgive NFIP’s debt. As noted earlier, Congress erased the program’s debt in 2017, and they can do this again. There is no economic risk if Congress erases debt between two parts of the same federal government. The terms of any further borrowing can also remove interest so that money paid back to Treasury goes directly to the principal. NFIP has paid $5.71 billion in interest alone since Hurricane Katrina (Federal Insurance and Mitigation Administration 2022).
Debt forgiveness would allow the NFIP to continue operations without having to raise rates or reduce coverage. Relief from debt and interest payments would also free up funds that might be utilized to upgrade the program’s infrastructure and make participating communities more resilient to future storms. The money spent on interest by the NFIP can go toward flood mapping and floodplain management, both of which are underfunded yet have the potential to reduce costs and mitigate disasters.
More money spent on FEMA’s pre-disaster mitigation grant programs, such as Hazard Mitigation grants and BRIC, also has the potential to bring down costs for FAIR Plans, but it requires more action from state insurance commissioners. If FAIR Plans fold mitigation efforts into premiums, it would encourage homeowners to do more to make their property disaster ready. The best example of this is the “good driver” discount in auto insurance or the programs that encourage exercise and a healthy diet in health insurance. These changes require a mandate from insurance commissioners, and it is already happening in some states. In September 2022, California Insurance Commissioner Ricardo Lara proposed a rule requiring all insurance providers to submit new rates that take into account the value of wildfire safety measures like upgraded roofs and windows, defensible space, and community-wide initiatives like Firewise USA or a designation as a Fire Risk Reduction Community by the state’s Board of Forestry and Fire Protection (California Department of Insurance 2022). The regulation’s purpose is to encourage homeowners to take precautions against wildfires and to make insurance more inexpensive for those who do.
Another way the NFIP and FAIR Plans can work hand-in-hand is mandated or opt-out coverage for when a homeowner obtains a policy in one program or the other. Florida started experimenting with this mandate in April 2023, requiring flood insurance for new Citizens residential policies with wind coverage in flood hazard areas. Over the next four years, the mandate will extend to all existing policyholders, not just new policies. Those who do not purchase flood insurance will not be eligible for coverage under Citizens (Chasan 2023).
One lesson FAIR Plans can learn from the NFIP is that lower maximum coverage caps on policies can bring down overall exposure; although state insurance commissioners certainly will find it politically unpopular. While the NFIP’s $250,000 coverage cap is low for the median home value in many parts of the US, those homeowners have the option of obtaining a second policy to cover the remaining value of a property. FAIR Plans could use median home value as a guidepost for coverage caps. According to ACS 5-year estimates, the median value of owner-occupied housing units in California from 2017-2021 was $573,200 (US Census Bureau 2022), but the statewide coverage cap is $3 million. The plan could modify caps county-by-county, like in Florida, where the statewide cap is $750,000 but $1 million in Miami-Dade and Monroe counties. Again, this change would be politically unpopular as higher coverage caps were put in place as part of a process that likely involved public feedback. But the alternative is more insurers pulling out from the market, leaving states to run the plans. The current financial situation of Florida and Louisiana’s plans demonstrates that this is not a viable option unless the federal government provides assistance.
States do not have the resources to prop up FAIR Plans indefinitely, but they can mitigate the effects of climated-related disasters by investing in disaster resilience and response using their own budgets, as well as using previously mentioned federal resources. Decreasing risk and increasing resilience is key to keeping the insurance market stable.
Other solutions have been proposed for the programs, such as a federally-funded voucher program to assist low-to-moderate income households in purchasing flood insurance, catastrophe insurance opt-outs for people purchasing homeowners insurance, and bolstering the private market (Kousky et al. 2018; 2019; Williams et al. 2023). All of these solutions deserve discussion in Congress.
Though they became two separate programs, the NFIP and FAIR Plans share a common history stemming from insurance crises of the 1960s. Congress placed one program in the hands of the federal government and the other in the hands of the states and the market. Neither program was designed with climate change in mind. Now, 55 years later, the US faces increased climate-related disasters, and the NFIP and FAIR Plans are struggling to keep up with rising claims.
For the NFIP, the problem lies in low take-up rates. Not enough communities are participating in the program, and those that are sit in high-risk coastal zones. With every hurricane or extreme storm event, claims spike, putting the program further in debt. That debt, paid to the US Treasury, comes with interest, and the program is spending more money paying off interest than investing in resilience and mitigation programs that can bring down costs. If Congress forgave that debt and renegotiated the borrowing terms to remove interest, the NFIP could pay down the principal while also investing in projects that would reduce cost and risk. And if the program could increase the number of participating communities, it could cover unexpected losses with more premiums rather than higher premiums.
For the FAIR Plans, an increasing number of insurers leaving the private market is sending more and more homeowners to the insurer of “last resort.” Unlike the NFIP, which aims to increase the number of policies in force, FAIR Plans are attempting to reduce that number since they were never designed as a long-term solution. To avoid situations such as depopulation processes, where homeowners are bounced between the private market, a FAIR Plan, and then back, states need to focus on resilience and mitigation efforts. These efforts include taking into account efforts to reduce risk when adjusting premiums at an individual policy level and utilizing state and federal resources to minimize risk at a community level. States also need to consider lowering maximum coverage caps. A broad application of this adjustment could hurt homeowners so that states could utilize median home value by county as a guide. Such a move would be a tough pill to swallow, but it is a vital step toward relieving pressure on insurers. A collapse of the private market would be far worse.
As the string of disasters in 2023 has shown, climate-related disasters can pop up anywhere. This is a national problem, not a coastal problem or a rural community problem. Policymakers need to take the steps necessary to address the issue before it gets worse. The proposed solutions in this paper are a step in that direction.
Abu-Lughod, Janet L. 2012. Race, Space, and Riots in Chicago, New York, and Los Angeles. First issued as an Oxford University Press paperback. New York, New York: Oxford University Press, Inc.
Alabama Insurance Underwriting Association. 2021. “Plan of Operation and Articles of Agreement of Alabama Insurance Underwriting Association.” https://www.aiua.org/system/refinery/resources/W1siZiIsIjIwMjEvMDEvMjAvM2hxZXQwYnNnYl9BSVVBX1BsYW5fb2ZfT3BlcmF0aW9uXzFfMDFfMjAyMS5wZGYiXV0/AIUA%20Plan%20of%20Operation%201-01-2021.pdf.
Atreya, Ajita, Susana Ferreira, and Erwann Michel-Kerjan. 2015. “What Drives Households to Buy Flood Insurance? New Evidence from Georgia.” Ecological Economics 117: 153–61. https://doi.org/10.1016/j.ecolecon.2015.06.024.
Beven II, John L., Andrew Hagen, and Robbie Berg. 2022. “National Hurricane Center Tropical Cyclone Report: Hurricane Ida.” National Hurricane Center. https://www.nhc.noaa.gov/data/tcr/AL092021_Ida.pdf.
Bienvenu, Germain. 2021. “Research Guides: Louisiana Hurricanes: Hurricane Betsy, 1965.” March 14, 2021. https://guides.lib.lsu.edu/Hurricanes/Betsy.
Booten, Kelly. 2022. “Residual Market Comparison.” Florida Citizens Property Insurance Corporation. https://www.citizensfla.com/documents/20702/28368994/20221207+02Ab+Residual+Market+Comparison.pdf/e69c723d-fb36-d5cd-1666-7e222c355e9a?t=1668827772613.
Browne, Mark, and Robert Hoyt. 2000. “The Demand for Flood Insurance: Empirical Evidence.” Journal of Risk and Uncertainty 20 (3): 291–306. https://doi.org/10.1023/A:1007823631497.
California Department of Insurance. 2013. “Information Sheet: Proposition 103 Intervenor Process.” Government. California Department of Insurance. November 15, 2013. https://www.insurance.ca.gov/01-consumers/150-other-prog/01-intervenor/info.cfm.
———. 2022. “Commissioner Lara Submits First-in-Nation Wildfire Safety Regulation to Drive down Cost of Insurance.” California Department of Insurance (blog). September 7, 2022. https://www.insurance.ca.gov/0400-news/0100-press-releases/2022/release064-2022.cfm.
Carrier Management. 2021. “U.S. Senators See ‘Actuarial Disaster’ on the Horizon With Flood Risk Rating 2.0.” ProQuest Central, October 8, 2021. https://www.proquest.com/docview/2580052396/abstract/18A9DDB81A20435CPQ/1.
Chasan, Aliza. 2023. “Here’s How Wildfire Burn Scars Could Intensify Flooding as Tropical Storm Hilary Hits California – CBS News.” August 20, 2023. https://www.cbsnews.com/news/burn-scars-tropical-storm-hilary-california-flooding-wildfire-impact/.
Citizens Property Insurance Corporation. 2013. “Citizens Property Insurance Corporation Plan of Operation.” https://www.citizensfla.com/documents/20702/42664/Plan+of+Operation/40eecc8b-0144-4471-a4b5-a99b9d45172a.
———. 2016. “Who We Are.” Government. Citizens Property Insurance Corporation. January 30, 2016. https://www.citizensfla.com/who-we-are.
———. 2023. “Flood Insurance Coverage Rules Kick In for Citizens.” Citizens Property Insurance Corporation. March 31, 2023. https://www.citizensfla.com/-/flood-insurance-coverage-rules-kick-in-for-citizens.
Collier, Stephen J. 2014. “Neoliberalism and Natural Disaster: Insurance as Political Technology of Catastrophe.” Journal of Cultural Economy 7 (3): 273–90. https://doi.org/10.1080/17530350.2013.858064.
Crail, Chauncey. 2023. “How Much Does It Cost To Raise A House In 2023?” Forbes Home. February 8, 2023. https://www.forbes.com/home-improvement/foundation/cost-to-raise-house/.
Department of the Army New Orleans District, Corps of Engineers. 1966. “Hurricane Betsy, 8-11 September, 1965: After-Action Report.” Lousiana Digital Library. https://louisianadigitallibrary.org/islandora/object/uno-p120701coll13:230.
Dwyer, Joanne. 1978. “Fair Plans: History, Holtzman and the Arson-for-Profit Hazard.” The Fordham Urban Law Journal 7. https://ir.lawnet.fordham.edu/cgi/viewcontent.cgi?referer=&httpsredir=1&article=1654&context=ulj.
Environmental Protection Agency. 2016. “Climate Change Indicators: River Flooding.” Reports and Assessments. July 1, 2016. https://www.epa.gov/climate-indicators/climate-change-indicators-river-flooding.
Federal Emergency Management Agency. 2021. “FEMA Updates Its Flood Insurance Rating Methodology to Deliver More Equitable Pricing | FEMA.Gov.” April 1, 2021. https://www.fema.gov/press-release/20210401/fema-updates-its-flood-insurance-rating-methodology-deliver-more-equitable.
———. 2023. “Risk Rating 2.0: Equity in Action.” June 5, 2023. https://www.fema.gov/flood-insurance/risk-rating.
Federal Insurance and Mitigation Administration. 2022. “The Watermark, Fiscal Year 2022, Fourth Quarter.” Volume 20. Federal Emergency Management Agency. https://www.fema.gov/sites/default/files/documents/fema_watermark-q4-fy22.pdf.
Finch II, Michael. 2022. “Louisiana Citizens Rate Increases Will Be as High as 111% in Some Parishes.” NOLA.Com. October 30, 2022. https://www.nola.com/news/hurricane/louisiana-citizens-rate-increases-will-be-as-high-as-111-in-some-parishes/article_4271d64a-5703-11ed-b1ca-c736ff2e5138.html.
Finch II, Michael, and Joseph Cranney. 2022. “State Program Placed Louisiana’s Riskiest Policies with Untested Insurers; Many Then Failed.” NOLA.Com. October 2, 2022. https://www.nola.com/news/business/state-program-placed-louisiana-s-riskiest-policies-with-untested-insurers-many-then-failed/article_538db4ee-40ce-11ed-b173-cb58e5889fac.html.
Flavelle, Christopher, Jill Cowan, and Ivan Penn. 2023. “Climate Shocks Are Making Parts of America Uninsurable. It Just Got Worse.” The New York Times, May 31, 2023, sec. Climate. https://www.nytimes.com/2023/05/31/climate/climate-change-insurance-wildfires-california.html.
Frith, Alan. 2017. “Developing a Comprehensive Wind Mitigation Incentive Program Is Complicated, but Modeling Simplifies the Task.” AIR Currents 2017 (Sep). https://www.air-worldwide.com/publications/air-currents/2017/developing-a-comprehensive-wind-mitigation-incentive-program-is-complicated-but-modeling-simplifies-the-task/.
Gallagher, Justin. 2014. “Learning about an Infrequent Event: Evidence from Flood Insurance Take-Up in the United States.” American Economic Journal. Applied Economics 6 (3): 206–33. https://doi.org/10.1257/app.6.3.206.
Governor’s Commission on the Los Angeles Riots. 1965. “Violence in the City — an End or the Beginning?” https://www.lc.edu/uploadedFiles/Pages/Services/Reid_Memorial_Library/McCone%20Commission%20Report%20Violence%20in%20the%20City%20Watts%20Neighborhood.pdf.
Hartwig, Robert P., and Claire Wilkinson. 2016. “Residual Market Property Plans: From Markets of Last Resort to Markets of First Choice.” Insurance Information Institute. https://www.iii.org/sites/default/files/docs/pdf/residual_markets_wp_051616.pdf.
Horn, Diane P. 2019. “A Brief Introduction to the National Flood Insurance Program: Homeland Security Issues in the 116th Congress.” CRS Insight. Congressional Research Service.
———. 2022. “National Flood Insurance Program Borrowing Authority.” IN10784. Congressional Research Service. https://crsreports.congress.gov/product/pdf/IN/IN10784.
Horowitz, Andy. 2020. “Help!: Hurricane Betsy and the Politics of Disaster in the Lower Ninth Ward, 1965–1967.” In Katrina: A History, 1915–2015, 44–68. Harvard University Press. http://www.jstor.org/stable/j.ctv1198zr5.6.
Kaenel, Camille Von. 2023. “Wildfires Are about to Burn California Politicians.” POLITICO (blog). August 21, 2023. https://www.politico.com/news/2023/08/21/wildfires-california-politicians-00112016.
Kaufman, Leslie. 2021. “Millions in Fire-Ravaged California Risk Losing Home Insurance.” Bloomberg.Com, September 25, 2021. https://www.bloomberg.com/news/articles/2021-09-25/millions-in-fire-ravaged-california-risk-losing-home-insurance.
Kentucky FAIR Plan Reinsurance Association. 2021. “Kentucky FAIR Plan Reinsurance Association Homeowner Manual.” Kentucky FAIR Plan Reinsurance Association. https://b18793.a2cdn1.secureserver.net/wp-content/uploads/2022/05/Homeowners-Manual-06.2022.pdf.
Kousky, Carolyn. 2018. “Financing Flood Losses: A Discussion of the National Flood Insurance Program.” Risk Management and Insurance Review 21 (1): 11–32. https://doi.org/10.1111/rmir.12090.
Kousky, Carolyn, Howard Kunreuther, Brett Lingle, and Leonard Shabman. 2018. “The Emerging Private Residential Flood Insurance Market in the United States.” Resources for the Future. https://media.rff.org/documents/Report_22-03_uf2AU47.pdf.
Kousky, Carolyn, and Brett Lingle. 2018. “The 3 Maps That Explain Residential Flood Insurance Purchases.” Environmental, Social and Governance (ESG) Initiative (blog). September 17, 2018. https://esg.wharton.upenn.edu/news/the-3-maps-that-explain-residential-flood-insurance-purchases/.
Kousky, Carolyn, Brett Lingle, Howard Kunreuther, and Leonard Shabman. 2019. “Moving the Needle on Closing the Flood Insurance Gap.” IB 23-02. Wharton Risk Management and Decision Processes Center. https://www.rff.org/publications/issue-briefs/moving-the-needle-on-closing-the-flood-insurance-gap/.
Krueger, Adam. 2021. “How Ida Compares to Louisiana’s Strongest Hurricanes.” CW39 Houston (blog). August 30, 2021. https://cw39.com/cw39/how-ida-compares-to-louisianas-strongest-hurricanes/.
Kunreuther, Howard. 1968. “The Case for Comprehensive Disaster Insurance.” The Journal of Law and Economics 11 (1): 133–63. https://doi.org/10.1086/466646.
Lara, Ricardo. 2022. “Note of Investigatory Hearing Into the California Fair Plan Association.” https://www.insurance.ca.gov/0250-insurers/0300-insurers/0200-bulletins/bulletin-notices-commiss-opinion/upload/NOTICE-OF-INVESTIGATORY-HEARING-INTO-THE-CALIFORNIA-FAIR-PLAN-ASSOCIATION.pdf.
———. 2023. “Prior Approval Rate Application Requirements to Comply with Title 10 of the California Code of Regulations, Section 2644.9(d).” https://www.insurance.ca.gov/0250-insurers/0300-insurers/0200-bulletins/bulletin-notices-commiss-opinion/upload/Bulletin-2023-2.pdf.
Lewis, John R. 1971. “A Critical Review of the Federal Riot Reinsurance System.” The Journal of Risk and Insurance 38 (1): 29–42. https://doi.org/10.2307/251085.
Louisiana Citizens Property Insurance Corporation. 2015. “Louisiana Citizens Property Insurance Corporation Plan of Operation.” https://www.lacitizens.com/docs/default-source/default-document-library/lcpic-plan-of-operation-05-29-2019.pdf?sfvrsn=85d3e303_2.
———. 2023. “Louisiana Citizens Property Insurance Corporation Depopulation Process Round 18.” https://www.lacitizens.com/docs/default-source/depop-round-18/depopulation-process—round-18-07102023.pdf.
Louisiana Department of Insurance. 2016. “Commissioner Donelon Names New CEO of Citizens.” Government. Louisiana Department of Insurance. June 1, 2016. https://www.ldi.la.gov/news/press-releases/6-1-16-commissioner-donelon-names-new-ceo-of-citizens.
———. 2022. “LDI Approves Citizens Rate Increase and Offers Tips for Policyholders.” Government. Louisiana Department of Insurance. October 10, 2022. https://www.ldi.la.gov/news/press-releases/10-10-22-ldi-approves-citizens-rate-increase-and-offers-tips-for-policyholders.
Louisiana State Legislature. 2013. “Boards and Commissions – Members.” Government. Louisiana State Legislature. January 6, 2013. https://www.legis.la.gov/legis/BoardMembers.aspx?boardId=749.
Malecki, Donald S. 2000. “Muddying the Waters with Flood Insurance.” Rough Notes 143 (5): 58–61.
Michel-Kerjan, Erwann O. 2010. “Catastrophe Economics: The National Flood Insurance Program.” Journal of Economic Perspectives 24 (4): 165–86. https://doi.org/10.1257/jep.24.4.165.
Moore, Frank. 1978. “Weekly Legislative Report.” The White House. https://www.jimmycarterlibrary.gov/digital_library/sso/148878/82/SSO_148878_082_09.pdf.
National Flood Insurance Program. 2018. “Flood Insurance Marketing Campaigns.” FloodSmart. July 18, 2018. https://agents.floodsmart.gov/marketing/campaigns.
———. 2020a. “Flood Insurance Coverage, Deductibles Explained.” FloodSmart. February 7, 2020. https://www.floodsmart.gov/policy-terms.
———. 2020b. “Write Your Own Flood Insurance Company List.” FloodSmart. June 5, 2020. https://nfipservices.floodsmart.gov/wyo-program-list.
———. 2022. “FY 2023 WYO Arrangement Changes.” Federal Emergency Management Administration. https://nfipservices.floodsmart.gov/wyo-program-arrangements.
Newsom, Michael. 2022. “UM Experts Warn About Consequences of Population Loss.” Ole Miss News. February 2, 2022. https://news.olemiss.edu/um-experts-warn-about-consequences-of-population-loss/.
Office of the Assistant Secretary for Fair Housing and Equal Opportunity, HUD. 2016. “Application of the Fair Housing Act’s Discriminatory Effects Standard to Insurance.” Federal Register. https://www.federalregister.gov/documents/2016/10/05/2016-23858/application-of-the-fair-housing-acts-discriminatory-effects-standard-to-insurance.
President’s National Advisory Panel on Insurance in Riot-Affected Areas. 1968. Meeting the Insurance Crisis of Our Cities. Hughes Report on Insurance in Riot-Affected Areas. Washington, D.C: [For sale by the Superintendent of Documents, U.S. Government Printing Office].
Property Insurance Plans Service Office. 1980. “FAIR Plan Report of Operations – New and Renewal Operational Data.”
Raby, John. 2021. “West Virginia Population Decline Is Largest in U.S.” Los Angeles Times. May 22, 2021. https://www.latimes.com/world-nation/story/2021-05-22/west-virginia-population-downtick-is-largest-in-us.
Saunders, Jim. 2023. “Florida Regulators Order Citizens to Revamp and Lower Property Insurance Rate Increases.” Sarasota Herald-Tribune (blog). August 21, 2023. https://www.heraldtribune.com/story/news/2023/08/21/florida-orders-citizens-property-insurance-corp-to-reduce-rate-hikes/70643169007/.
Schuppe, Jon. 2022. “Louisiana Faces an Insurance Crisis, Leaving People Afraid They Can’t Afford Their Homes.” NBC News. September 16, 2022. https://www.nbcnews.com/news/us-news/louisiana-homeowners-insurance-crisis-hurricanes-rcna46746.
Scott, Amy. 2023. “House Lifting Grows as Communities Grapple with Flooding.” Marketplace (blog). January 9, 2023. https://www.marketplace.org/2023/01/09/lifting-homes-flood-risk-sea-level-rise-wetter-storms-climate-change/.
Task Force on Federal Flood Control Policy. 1966. “A Unified National Program for Managing Flood Loss.” 89th Congress, 2nd Session. https://usace-cwbi-prod-il2-nld2-docs.s3-us-gov-west-1.amazonaws.com/ce7fe847-9a19-4f13-a3f8-d1d32616c352/1966_Unified%20TF%20on%20Fed%20Flood%20Control%20Policy.pdf.
The American Institutes for Research, The Pacific Institute for Research and Evaluation, and Deloitte & Touche LLP. 2005. “A Chronology of Major Events Affecting the National Flood Insurance Program.” https://www.fema.gov/sites/default/files/2020-07/fema_nfip_eval_chronology.pdf.
The National Advisory Commission on Civil Disorders. 2016. The Kerner Report. Princeton University Press. https://doi.org/10.2307/j.ctvcszz6s.
US Census Bureau. 2022. “2017-2021 American Community Survey 5-Year Estimates Median Value of Owner-Occupied Housing Units.” https://www.census.gov/quickfacts/fact/table/CA/PST045222.
US DC Dist. So Dak. 1999. Stanton v. State Farm Fire & Cas. Co., 1999 DSD 37, 78 F. Supp. 2d 1029, 1999 U.S. Dist. LEXIS 20248. United States District Court for the District of South Dakota, Northern Division.
US Geological Survey. 2022. “What Are the Two Types of Floods?” US Geological Survey. September 9, 2022. https://www.usgs.gov/faqs/what-are-two-types-floods.
U.S. Government Accountability Office. 2009. “Flood Insurance: Opportunities Exist to Improve Oversight of the WYO Program.” Government Accountability Office. https://www.gao.gov/products/gao-09-455.
Valdivia, Freddy. 2017. “Privacy Impact Assessment for the National Flood Insurance Program (NFIP) Direct Servicing Agent (NFIP Direct) System.” https://www.dhs.gov/sites/default/files/publications/privacy-pia-fema-048-nfipdirect-october2017.pdf.
Virginia Property Insurance Association. 2005. “Virginia Property Insurance Association Plan of Operations.” http://www.vpia.com/wp/wp-content/uploads/2015/02/plan_ops.pdf.
Webel, Baird. 2019. “Protecting America: The Reauthorization of the Terrorism Risk Insurance Program.” Congressional Research Service.
Williams, Rebecca, Lorilee Medders, David Marlett, Catherine Lattimore, and David Evans. 2023. “Flood Insurance Redesigned: Regulatory Considerations for a Viable and Sustainable Private Market.” Journal of Insurance Regulation. https://doi.org/10.52227/26443.2023.
| State | Max Dollar Amount of Coverage |
|---|---|
| Alabama | $500,000 for dwelling, $250,000 for personal property |
| California | $3 million |
| Connecticut | $350,000 dwelling, $75,000 for personal property PER LOCATION |
| Delaware | $500,000 for building and contents combined |
| DC | Coverage A Dwelling- $455,000 Coverage C Contents – $227,500 |
| Florida | Maxiumum – $750,000, but $1 million in Miami-Dade and Monroe counties |
| Georgia | minimum – $25,000 maximum $2,000,000 (combined building/contents) |
| Hawaii | The coverage limit ranges from $50,000 to $450,000. |
| Illinois | Maximum $750,000 limit on dwelling |
| Indiana | max $250,000 (building and contents) |
| Iowa | ACV coverage up to two times the assessed value or a total of $250,000 whichever is less. |
| Kentucky | DP-1: Minimum $1,000 maximum $200,000. DP-2: Minimum $15,000 maximum $200,000. HO-8: Minimum $25,000 maximum of $200,000. HO-2 Minimum $35,000 maximum of $200,000. HO-4 Minimum $5,000 maximum of $25,000. HO-6 Minimum coverage for building $5,000 with a maximum of $200,000. Minimum coverage for contents of $5,000 with a maximum of $25,000. |
| Louisiana | Building: $1 million, $500,000: contents and property |
| Maryland | $455,000 building, $228,000 contents/property |
| Massachusetts | $1 million for single location single event, $1.5 million for all events at one location |
| Mississippi | $200k for dwelling and $75k for property. Coverage may not be written higher than 95% of ACV of property |
| $1 million max for structure, $250k max on content | |
| Missouri | $200k residential |
| New Jersey | $600k max residential |
| New Mexico | $150,000 to $250,000 on residential |
| New York | $600k on occupied building + $250,000 for contents, $100k on vacant property |
| North Carolina | The maximum residential limit of building coverage is $750,000, with a limit for personal property capped at 40% of the approved building coverage |
| The maximum commercial combined limit is $3 million; capped at a $6 million aggregate depending on fire wall divisions of the structure insured. If the coverage required exceeds the maximum building limit of the Coastal Property Insurance Pool, then excess coverage above the limit provided must be purchased to the full value of the property, prior to the issuance of a primary policy by the Coastal Property Insurance Pool. | |
| Ohio | $1.5 million |
| Oregon | Limits up to $600,000 total value. Higher limits are available through the use of special facultative reinsurance and the cost of the facultative reinsurance is included in the total policy premium. |
| Pennsylvania | $500,000 occupied home, and $335,000 for a vacant home |
| Rhode Island | $750,000 per location |
| South Carolina | Up to $1.3 million of protection (structure, contents, loss of use, increased cost of construction) for personal risks such as dwellings, mobile homes, and condominium units. |
| Texas | $1 million for building, $500,000 for contents |
| Virginia | $500,000 per location |
| Washington | The maximum coverage available under a dwelling or commercial policy is $1,500,000. Policies are issued only on an “actual cash value” basis. |
| West Virginia | Up to $200,000 for each private dwelling |
| Wisconsin | $350,000 for building |
