

August 12, 2021

Social Security is a vital program for many seniors. It is primarily funded by a payroll tax on wage and salary income below a given threshold. Several proposals to improve Social Security’s long-term fiscal outlook involve raising, eliminating, or otherwise modifying the tax cap in order to expand the program’s contribution base.
This report calculates how many people would be directly affected by modifications to the cap, and explores the characteristics of this group. Ultimately, we find that only a small percentage of earners would be affected. We also find that Black and Hispanic workers, women, and younger workers are underrepresented among the highest earners. Finally, we note that those whose earnings exceed the taxable maximum are more likely to have additional unearned, non-retirement income flows that escape the payroll tax altogether.
This month marks the 86th anniversary of the Social Security Act, which was signed into law by President Franklin D. Roosevelt on August 14, 1935. In creating Social Security, the Act brought into being an immensely popular program (Newport, 2019) that has lifted more Americans out of poverty than any other initiative in the nation’s history (Romig, 2020). In recent years, however, Social Security has been dogged by concerns about its long-term viability. While the program’s financial straits are sometimes overstated (Rawlins, 2020), its projected funding shortfalls merit attention. Assuming no changes are made, the most recently available Trustees report (as of this writing) indicates that Social Security will be able to pay out full benefits through 2034, after which it will be able to pay 76 percent of scheduled retiree benefits.
The Old-Age, Survivors, and Disability Insurance program (OASDI), commonly known as Social Security, derives its funding primarily from a 12.4 percent payroll tax, split evenly between employers and their employees. The amount of wage and salary income subject to the tax is capped at a level determined by the national average wage index. In 2021, the tax is not applied to individual earnings in excess of $142,800. This means that millionaires stopped contributing to the program in February of this year (Rawlins, 2021).
Proposals to make Social Security more sustainable tend to focus on either reducing benefits or increasing revenue. While doing the former would be devastating for many seniors (Romig, 2020), the latter could be done painlessly for most Americans by modifying the cap on taxable earnings to expand the contributions base. This would also make the payroll tax less regressive than it is now, as the current tax cap allows those with earnings above the taxable maximum to pay a lower effective rate than those whose entire incomes are subject to the tax.
There have been several proposals to modify the taxable maximum in recent years. In addition to more straightforward motions to simply raise the cap, there are some that would establish a “donut hole” structure to specifically reimpose the payroll tax on the highest earners. A revived bill from Sen. Bernie Sanders and Rep. Peter DeFazio would exempt earnings between the set maximum and $250,000 from the payroll tax and reinstate the tax for earnings over $250,000 (NCPSSM, 2019). Were this proposal applied in 2021, it would mean that wage and salary income between $142,800 and $250,000 would not be subject to the payroll tax, but any annual earnings in excess of $250,000 would be taxable. A plan endorsed by President Biden (Konish, 2021) and reminiscent of the Social Security 2100 Act introduced by Rep. John Larson would create a similar “donut hole”, bringing back the payroll tax for earnings in excess of $400,000. More ambitious proposals would scrap the cap entirely (CEPR, 2021) and subject all earnings to the payroll tax, replacing Social Security’s projected shortfall with an opportunity to expand benefits for vulnerable seniors.
Though conservatives have railed against the unfairness of raising or eliminating the cap, it is worth considering how many people would actually end up paying more if earnings above the current limit were taxed. This report uses data from the most recent one-year sample of the American Community Survey (ACS) to determine how many workers would be directly affected by changes to the taxable maximum. We also use this data to update and expand upon previous CEPR research (Barber & Brown, 2019) exploring the characteristics of those who might end up paying more. To focus on those with significant attachment to work, we restrict the sample in this analysis to those over the age of 16 who typically work at least 10 hours per week and who reported working at least 14 weeks in the previous 12 months. This has the effect of making our estimates more conservative, in the sense that those who do not meet these criteria tend to earn less. As the most recent ACS Public Use Microdata Sample is from 2019, the reported earnings are adjusted for inflation using projections from the Congressional Budget Office (CBO Table B-1, 2020) for 2020 and 2021.
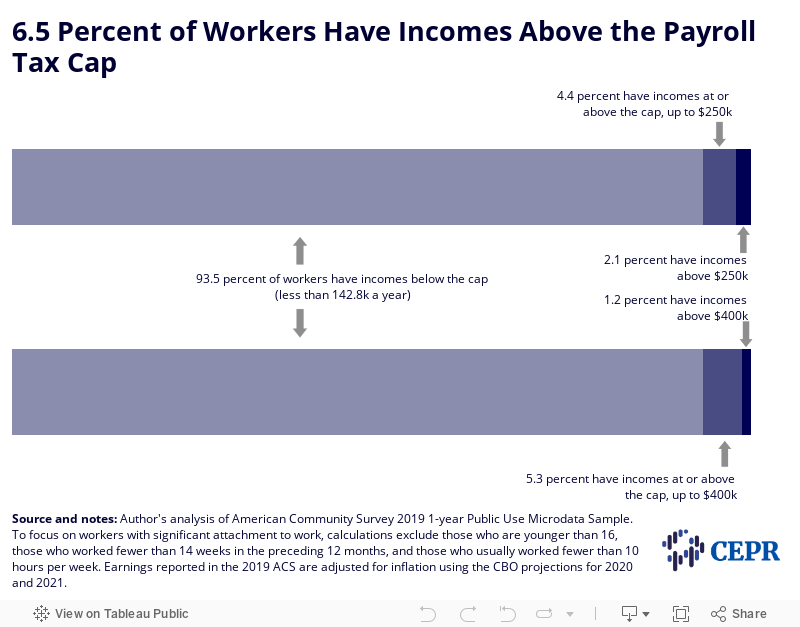
The majority of earners — 93.5 percent — would see no changes in their paychecks, as the entirety of their earnings falls below the current maximum (Figure 1). Even fewer would be impacted by the donut hole scenarios; just 2.1 percent of workers have wage and salary incomes over $250,000 per year, and only 1.2 percent earn over $400,000 per year.
Figure 1
Just 2.5 percent of Black and Hispanic workers would pay more if the current payroll tax cap were raised (Table 1). This drops to just over half of one percent if the threshold increases to $250,000 (0.6 and 0.7 percent for Black and Hispanic workers, respectively). Only 0.4 percent of Black and Hispanic workers — less than 200,000 people — have wage and salary incomes in excess of $400,000 per year. By contrast, just under 8 percent of non-Hispanic white workers have annual earnings over $142,8000, and almost 12 percent of Asian workers make above this threshold. These discrepancies are even more pronounced for higher incomes. The percentage of non-Hispanic whites with wage and salary incomes over $400,000 is more than three times the percentage of Blacks and Hispanics with incomes in this range.
| Over $142,800 | Over $250,000 | Over $400,000 | |||||||
|---|---|---|---|---|---|---|---|---|---|
| Race/Ethnicity | Percent | Number (in thousands) | Percent | Number (in thousands) | Percent | Number (in thousands) | |||
| All | 6.5 | 10,300 | 2.1 | 3,317 | 1.2 | 1,862 | |||
| White | 7.9 | 7,731 | 2.6 | 2,593 | 1.5 | 1,479 | |||
| Black | 2.5 | 492 | 0.6 | 121 | 0.4 | 70 | |||
| Hispanic | 2.5 | 707 | 0.7 | 197 | 0.4 | 105 | |||
| Asian | 11.9 | 1,327 | 3.5 | 385 | 1.8 | 195 | |||
| Other | 3.8 | 72 | 1.1 | 22 | 0.6 | 12 | |||
Source and notes: Author’s analysis of American Community Survey 2019 1-year Public Use Microdata Sample. To focus on workers with significant attachment to work, calculations exclude those who are younger than 16, those who worked fewer than 14 weeks in the preceding 12 months, and those who usually worked fewer than 10 hours per week. Percentages reflect the share of workers in each race/ethnic group with annual earnings above the indicated level. Earnings reported in the 2019 ACS are adjusted for inflation using the CBO projections for 2020 and 2021.
Workers with earnings above the current cap are disproportionately white and Asian compared to all workers that meet our criteria (Table 2), and those with earnings over $250,000 and $400,000 are even more so. While Black workers make up 12.5 percent of the workers in our sample, only 3.8 percent of those with annual earnings over $400,000 are Black. Similarly, while nearly 17.8 percent of workers in our sample identify as Hispanic, they make up only 5.7 percent of those who earn over $400,000 per year.
| All Workers* | Over $142,800 | Over $250,000 | Over $400,000 | |||||||||
|---|---|---|---|---|---|---|---|---|---|---|---|---|
| Race/Ethnicity | Percent | Number (in thousands) | Percent | Number (in thousands) | Percent | Number (in thousands) | Percent | Number (in thousands) | ||||
| White | 61.5 | 98,016 | 74.8 | 7,731 | 78.2 | 3,317 | 79.4 | 1,862 | ||||
| Black | 12.5 | 19,980 | 4.8 | 492 | 3.7 | 2,593 | 3.8 | 1,479 | ||||
| Hispanic | 17.8 | 28,348 | 6.8 | 707 | 5.9 | 121 | 5.7 | 70 | ||||
| Asian | 7.0 | 11,121 | 12.9 | 1,327 | 11.6 | 197 | 10.5 | 105 | ||||
| Other | 1.2 | 1,921 | 0.7 | 72 | 0.7 | 385 | 0.7 | 195 | ||||
Source and notes: Author’s analysis of American Community Survey 2019 1-year Public Use Microdata Sample. Percentages refer to the racial/ethnic composition of workers with annual earnings above the indicated level. Earnings reported in the 2019 ACS are adjusted for inflation using the CBO projections for 2020 and 2021.
*To focus on workers with significant attachment to work, calculations exclude those who are younger than 16, those who worked fewer than 14 weeks in the preceding 12 months, and those who usually worked fewer than 10 hours per week.
Our findings also show gendered effects. Men significantly outnumber women among those who make above the current cap, and the discrepancy becomes more pronounced as one moves up the pay scale (Table 3). This dynamic persists across racial and ethnic groups. That said, a larger share of women than men with earnings above the current tax ceiling are Black or Asian (Table 4).
| Over $142,800 | Over $250,000 | Over $400,000 | |||||||||||||||
|---|---|---|---|---|---|---|---|---|---|---|---|---|---|---|---|---|---|
| Men | Women | Men | Women | Men | Women | ||||||||||||
| Race/Ethnicity | Percent | Number (in thousands) | Percent | Number (in thousands) | Percent | Number (in thousands) | Percent | Number (in thousands) | Percent | Number (in thousands) | Percent | Number (in thousands) | |||||
| All | 9.0 | 7,608 | 3.6 | 2,721 | 3.1 | 2,588 | 1.0 | 730 | 1.8 | 1,483 | 0.5 | 379 | |||||
| White | 11.1 | 5,828 | 4.2 | 1,903 | 3.9 | 2,068 | 1.1 | 525 | 2.3 | 1,205 | 0.6 | 274 | |||||
| Black | 3.1 | 296 | 1.9 | 197 | 0.8 | 78 | 0.4 | 43 | 0.5 | 45 | 0.2 | 25 | |||||
| Hispanic | 3.3 | 525 | 1.5 | 182 | 1.0 | 154 | 0.3 | 43 | 0.5 | 82 | 0.2 | 23 | |||||
| Asian | 15.7 | 906 | 7.9 | 421 | 4.7 | 271 | 2.1 | 114 | 2.4 | 141 | 1.0 | 55 | |||||
| Other | 5.3 | 53 | 2.1 | 19 | 1.7 | 17 | 0.5 | 5 | 1.0 | 10 | 0.2 | 2 | |||||
Source and notes: Author’s analysis of American Community Survey 2019 1-year Public Use Microdata Sample. To focus on workers with significant attachment to work, calculations exclude those who are younger than 16, those who worked fewer than 14 weeks in the preceding 12 months, and those who usually worked fewer than 10 hours per week. Percentages reflect the share of workers with annual earnings above the indicated level in each combined race/ethnicity and gender group. Earnings reported in the 2019 ACS are adjusted for inflation using the CBO projections for 2020 and 2021.
| All Workers* | Over $142,800 | Over $250,000 | Over $400,000 | ||||||||||||||||||||
|---|---|---|---|---|---|---|---|---|---|---|---|---|---|---|---|---|---|---|---|---|---|---|---|
| Men | Women | Men | Women | Men | Women | Men | Women | ||||||||||||||||
| Race/Ethnicity | Percent | Number (in thousands) | Percent | Number (in thousands) | Percent | Number (in thousands) | Percent | Number (in thousands) | Percent | Number (in thousands) | Percent | Number (in thousands) | Percent | Number (in thousands) | Percent | Number (in thousands) | |||||||
| White | 62.0 | 52,364 | 60.9 | 45,652 | 76.6 | 5,828 | 69.9 | 1,903 | 79.9 | 2,068 | 71.9 | 525 | 81.3 | 1,205 | 72.2 | 274 | |||||||
| Black | 11.1 | 9,405 | 14.1 | 10,574 | 3.9 | 296 | 7.2 | 197 | 3.0 | 78 | 5.9 | 43 | 3.0 | 45 | 6.6 | 25 | |||||||
| Hispanic | 18.8 | 15,905 | 16.6 | 12,443 | 6.9 | 525 | 6.7 | 182 | 5.9 | 154 | 5.9 | 43 | 5.5 | 82 | 6.2 | 23 | |||||||
| Asian | 6.8 | 5,768 | 7.1 | 5,352 | 11.9 | 906 | 15.5 | 421 | 10.5 | 271 | 15.7 | 114 | 9.5 | 141 | 14.4 | 55 | |||||||
| Other | 1.2 | 998 | 1.2 | 924 | 0.7 | 53 | 0.7 | 19 | 0.7 | 17 | 0.7 | 5 | 0.7 | 10 | 0.6 | 2 | |||||||
Source and notes: Author’s analysis of American Community Survey 2019 1-year Public Use Microdata Sample. Percentages refer to the racial/ethnic composition of workers of the specified gender with annual earnings above the indicated level. Earnings reported in the 2019 ACS are adjusted for inflation using the CBO projections for 2020 and 2021.
*To focus on workers with significant attachment to work, calculations exclude those who are younger than 16, those who worked fewer than 14 weeks in the preceding 12 months, and those who usually worked fewer than 10 hours per week.
Workers between the ages of 45 and 64 would be more heavily impacted by the proposed changes to the tax cap (Table 5). However, just over 3 percent of workers in this age range have annual earnings above $250,000, and less than 2 percent have earnings above $400,000. Higher earners skew slightly older than the overall working population (Table 6). Workers under the age of 35 make up over a third of workers in our sample, but only about one-in-ten workers with earnings above the current cap falls in this age range.
| Over $142,800 | Over $250,000 | Over $400,000 | ||||||
|---|---|---|---|---|---|---|---|---|
| Age Group | Percent | Number (in thousands) | Percent | Number (in thousands) | Percent | Number (in thousands) | ||
| All | 6.5 | 10,300 | 2.1 | 3,317 | 1.2 | 1,862 | ||
| 16-24 | 0.2 | 35 | 0.1 | 13 | 0.1 | 11 | ||
| 25-34 | 2.8 | 1,013 | 0.6 | 230 | 0.3 | 108 | ||
| 35-44 | 8.0 | 2,704 | 2.4 | 820 | 1.3 | 444 | ||
| 45-54 | 10.0 | 3,210 | 3.3 | 1,052 | 1.8 | 593 | ||
| 55-64 | 9.5 | 2,586 | 3.2 | 882 | 1.9 | 520 | ||
| 65+ | 8.2 | 781 | 3.3 | 320 | 1.9 | 186 | ||
Source and notes: Author’s analysis of American Community Survey 2019 1-year Public Use Microdata Sample. To focus on workers with significant attachment to work, calculations exclude those who are younger than 16, those who worked fewer than 14 weeks in the preceding 12 months, and those who usually worked fewer than 10 hours per week. Percentages reflect the share of workers in each age group with annual earnings above the indicated level. Earnings reported in the 2019 ACS are adjusted for inflation using the CBO projections for 2020 and 2021.
| All Workers* | Over $142,800 | Over $250,000 | Over $400,000 | ||||||||
|---|---|---|---|---|---|---|---|---|---|---|---|
| Age Group | Percent | Number (in thousands) | Percent | Number (in thousands) | Percent | Number (in thousands) | Percent | Number (in thousands) | |||
| 16-24 | 12.4 | 19,793 | 0.3 | 35 | 0.4 | 13 | 0.6 | 11 | |||
| 25-34 | 23.0 | 36,714 | 9.8 | 1,013 | 6.9 | 230 | 5.8 | 108 | |||
| 35-44 | 21.3 | 33,882 | 26.2 | 2,704 | 24.7 | 820 | 23.9 | 444 | |||
| 45-54 | 20.2 | 32,187 | 31.1 | 3,210 | 31.7 | 1,052 | 31.8 | 593 | |||
| 55-64 | 17.1 | 27,248 | 25.0 | 2,586 | 26.6 | 882 | 27.9 | 520 | |||
| 65+ | 6.0 | 9,561 | 7.6 | 781 | 9.7 | 320 | 10.0 | 186 | |||
Source and notes: Author’s analysis of American Community Survey 2019 1-year Public Use Microdata Sample. Percentages refer to the age group composition of workers with annual earnings above the indicated level. Earnings reported in the 2019 ACS are adjusted for inflation using the CBO projections for 2020 and 2021.
*To focus on workers with significant attachment to work, calculations exclude those who are younger than 16, those who worked fewer than 14 weeks in the preceding 12 months, and those who usually worked fewer than 10 hours per week.
A higher percentage of men than women have earnings above $142,800, $250,000, and $400,000 in all age groups (Table 7). However, the gender gap is slightly less pronounced for younger workers than older workers. Younger women make up a slightly larger share of women earning over $400,00 per year than younger men do of men at this earnings level (Table 8).
| Over $142,800 | Over $250,000 | Over $400,000 | |||||||||||||||
|---|---|---|---|---|---|---|---|---|---|---|---|---|---|---|---|---|---|
| Men | Women | Men | Women | Men | Women | ||||||||||||
| Age Group | Percent | Number (in thousands) | Percent | Number (in thousands) | Percent | Number (in thousands) | Percent | Number (in thousands) | Percent | Number (in thousands) | Percent | Number (in thousands) | |||||
| All | 9.0 | 7,608 | 3.6 | 2,721 | 3.1 | 2,588 | 1.0 | 730 | 1.8 | 1,483 | 0.5 | 379 | |||||
| 16-24 | 0.3 | 26 | 0.1 | 9 | 0.1 | 10 | 0.0 | 4 | 0.1 | 8 | 0.0 | 3 | |||||
| 25-34 | 3.6 | 708 | 1.8 | 306 | 0.8 | 166 | 0.4 | 64 | 0.4 | 80 | 0.2 | 28 | |||||
| 35-44 | 10.7 | 1,938 | 4.9 | 766 | 3.4 | 615 | 1.3 | 205 | 1.9 | 341 | 0.7 | 103 | |||||
| 45-54 | 13.9 | 2,355 | 5.6 | 855 | 4.8 | 820 | 1.5 | 232 | 2.8 | 473 | 0.8 | 119 | |||||
| 55-64 | 13.7 | 1,953 | 4.9 | 633 | 5.0 | 709 | 1.3 | 173 | 3.0 | 424 | 0.7 | 96 | |||||
| 65+ | 11.8 | 627 | 3.6 | 154 | 5.0 | 268 | 1.2 | 52 | 3.0 | 157 | 0.7 | 29 | |||||
Source and notes: Author’s analysis of American Community Survey 2019 1-year Public Use Microdata Sample. To focus on workers with significant attachment to work, calculations exclude those who are younger than 16, those who worked fewer than 14 weeks in the preceding 12 months, and those who usually worked fewer than 10 hours per week. Percentages reflect the share of workers with annual earnings above the indicated level in each combined age and gender group. Earnings reported in the 2019 ACS are adjusted for inflation using the CBO projections for 2020 and 2021.
| All Workers* | Over $142,800 | Over $250,000 | Over $400,000 | ||||||||||||||||||||
|---|---|---|---|---|---|---|---|---|---|---|---|---|---|---|---|---|---|---|---|---|---|---|---|
| Men | Women | Men | Women | Men | Women | Men | Women | ||||||||||||||||
| Age Group | Percent | Number (in thousands) | Percent | Number (in thousands) | Percent | Number (in thousands) | Percent | Number (in thousands) | Percent | Number (in thousands) | Percent | Number (in thousands) | Percent | Number (in thousands) | Percent | Number (in thousands) | |||||||
| 16-24 | 12.0 | 10,162 | 12.9 | 9,630 | 0.4 | 26 | 0.3 | 9 | 0.4 | 10 | 0.5 | 4 | 0.6 | 8 | 0.8 | 3 | |||||||
| 25-34 | 23.2 | 19,569 | 22.9 | 17,145 | 9.3 | 708 | 11.2 | 306 | 6.4 | 166 | 8.7 | 64 | 5.4 | 80 | 7.4 | 28 | |||||||
| 35-44 | 21.5 | 18,192 | 20.9 | 15,691 | 25.5 | 1,938 | 28.1 | 766 | 23.8 | 615 | 28.1 | 205 | 23.0 | 341 | 27.3 | 103 | |||||||
| 45-54 | 20.1 | 16,942 | 20.3 | 15,245 | 31.0 | 2,355 | 31.4 | 855 | 31.7 | 820 | 31.8 | 232 | 31.9 | 473 | 31.5 | 119 | |||||||
| 55-64 | 16.9 | 14,246 | 17.4 | 13,001 | 25.7 | 1,953 | 23.3 | 633 | 27.4 | 709 | 23.7 | 173 | 28.6 | 424 | 25.3 | 96 | |||||||
| 65+ | 6.3 | 5,328 | 5.7 | 4,233 | 8.3 | 627 | 5.7 | 154 | 10.4 | 268 | 7.2 | 52 | 10.6 | 157 | 7.6 | 29 | |||||||
Source and notes: Author’s analysis of American Community Survey 2019 1-year Public Use Microdata Sample. Percentages refer to the age composition of workers of the specified gender with annual earnings above the indicated level. Earnings reported in the 2019 ACS are adjusted for inflation using the CBO projections for 2020 and 2021.
*To focus on workers with significant attachment to work, calculations exclude those who are younger than 16, those who worked fewer than 14 weeks in the preceding 12 months, and those who usually worked fewer than 10 hours per week.
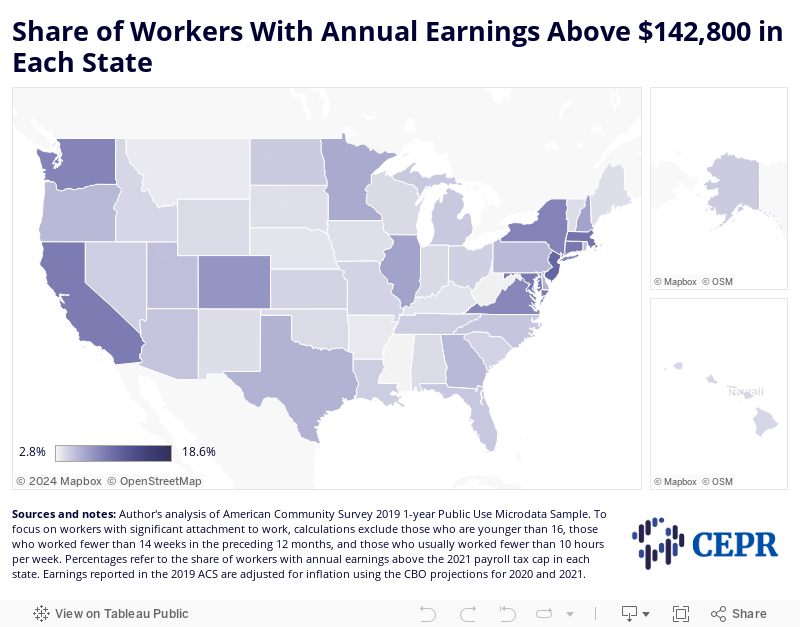
There is also sizable geographical variation in the percentage of workers with earnings above the cap. These earners make up a far larger share of workforce in some states than in others (Figure 2). Washington, D.C. has the highest concentration of workers with earnings above the cap, followed by New Jersey and Massachusetts (Table 9). Mississippi has the smallest concentration of workers with earnings above the current cap, followed by West Virginia and Montana. The state with the largest share of workers with annual earnings in excess of $400,000 is Connecticut. Yet even there, 98.2 percent of workers report annual earnings below that threshold. Meanwhile, in Alaska, not a single worker in our sample reported wage and salary income over $400,000, and less than a tenth of a percent of West Virginians reported income that high. In Alabama and Idaho, not a single woman reported earnings above $400,000 (Table 10).
Figure 2
| Over $142,800 | Over $250,000 | Over $400,000 | ||||||
|---|---|---|---|---|---|---|---|---|
| State | Percent | Number (in thousands) | Percent | Number (in thousands) | Percent | Number (in thousands) | ||
| All | 6.5 | 10,300 | 2.1 | 3,317 | 1.2 | 1,862 | ||
| AL | 3.8 | 83 | 1.4 | 30 | 0.1 | 3 | ||
| AK | 4.7 | 17 | 1.3 | 5 | 0.0 | 0 | ||
| AZ | 5.0 | 168 | 1.6 | 52 | 1.2 | 40 | ||
| AR | 3.3 | 44 | 1.4 | 19 | 1.1 | 15 | ||
| CA | 9.5 | 1,808 | 3.0 | 568 | 1.5 | 278 | ||
| CO | 7.7 | 236 | 2.3 | 70 | 1.2 | 36 | ||
| CT | 9.6 | 176 | 3.6 | 65 | 1.8 | 33 | ||
| DE | 6.0 | 29 | 1.7 | 8 | 1.4 | 6 | ||
| DC | 18.6 | 71 | 4.6 | 18 | 1.7 | 6 | ||
| FL | 4.9 | 489 | 1.7 | 174 | 1.2 | 117 | ||
| GA | 5.7 | 288 | 1.9 | 95 | 1.3 | 66 | ||
| HI | 4.1 | 30 | 1.1 | 8 | 0.9 | 6 | ||
| ID | 4.1 | 35 | 1.4 | 12 | 0.1 | 1 | ||
| IL | 7.0 | 439 | 2.3 | 143 | 1.2 | 78 | ||
| IN | 4.0 | 129 | 1.3 | 43 | 1.2 | 39 | ||
| IA | 3.7 | 60 | 1.5 | 24 | 1.1 | 18 | ||
| KS | 4.3 | 63 | 1.5 | 22 | 1.0 | 14 | ||
| KY | 3.6 | 73 | 1.3 | 27 | 1.1 | 23 | ||
| LA | 4.6 | 94 | 1.5 | 30 | 0.2 | 3 | ||
| ME | 3.8 | 25 | 1.1 | 8 | 1.0 | 7 | ||
| MD | 9.6 | 297 | 2.3 | 72 | 1.1 | 33 | ||
| MA | 10.1 | 367 | 3.2 | 116 | 1.3 | 47 | ||
| MI | 4.8 | 229 | 1.5 | 71 | 1.2 | 56 | ||
| MN | 6.5 | 193 | 2.0 | 59 | 1.1 | 33 | ||
| MS | 2.8 | 35 | 1.3 | 17 | 1.1 | 14 | ||
| MO | 4.3 | 126 | 1.5 | 43 | 1.1 | 33 | ||
| MT | 3.2 | 17 | 1.4 | 7 | 1.1 | 6 | ||
| NE | 3.4 | 35 | 1.3 | 13 | 0.9 | 10 | ||
| NV | 4.5 | 67 | 1.5 | 22 | 1.2 | 18 | ||
| NH | 7.0 | 51 | 2.0 | 15 | 1.2 | 9 | ||
| NJ | 11.1 | 497 | 3.6 | 159 | 1.5 | 66 | ||
| NM | 3.7 | 35 | 1.5 | 14 | 0.1 | 1 | ||
| NY | 9.0 | 857 | 3.2 | 305 | 1.5 | 145 | ||
| NC | 5.0 | 250 | 1.6 | 81 | 1.0 | 52 | ||
| ND | 4.7 | 20 | 1.7 | 7 | 1.5 | 6 | ||
| OH | 4.4 | 250 | 1.5 | 83 | 1.2 | 66 | ||
| OK | 3.9 | 70 | 1.4 | 26 | 1.2 | 22 | ||
| OR | 5.7 | 117 | 1.7 | 36 | 1.1 | 22 | ||
| PA | 5.7 | 354 | 1.8 | 112 | 1.0 | 65 | ||
| RI | 5.3 | 29 | 1.6 | 9 | 0.9 | 5 | ||
| SC | 4.3 | 103 | 1.4 | 34 | 1.1 | 27 | ||
| SD | 3.7 | 17 | 1.2 | 5 | 0.8 | 4 | ||
| TN | 4.6 | 149 | 1.8 | 58 | 1.1 | 35 | ||
| TX | 6.1 | 843 | 1.9 | 264 | 1.1 | 148 | ||
| UT | 5.3 | 84 | 1.8 | 29 | 1.2 | 19 | ||
| VT | 3.8 | 13 | 1.3 | 4 | 0.9 | 3 | ||
| VA | 8.7 | 377 | 2.0 | 88 | 1.2 | 52 | ||
| WA | 8.9 | 339 | 2.5 | 94 | 1.0 | 38 | ||
| WV | 2.9 | 22 | 1.3 | 10 | 0.0 | 0 | ||
| WI | 4.0 | 119 | 1.4 | 42 | 1.0 | 31 | ||
| WY | 3.9 | 11 | 1.5 | 4 | 1.1 | 3 | ||
Source and notes: Author’s analysis of American Community Survey 2019 1-year Public Use Microdata Sample. To focus on workers with significant attachment to work, calculations exclude those who are younger than 16, those who worked fewer than 14 weeks in the preceding 12 months, and those who usually worked fewer than 10 hours per week. Percentages refer to the share of workers with annual earnings above the indicated level in each state. Earnings reported in the 2019 ACS are adjusted for inflation using the CBO projections for 2020 and 2021.
| Over $142,800 | Over $250,000 | Over $400,000 | |||||||||||||||
|---|---|---|---|---|---|---|---|---|---|---|---|---|---|---|---|---|---|
| Men | Women | Men | Women | Men | Women | ||||||||||||
| State | Percent | Number (in thousands) | Percent | Number (in thousands) | Percent | Number (in thousands) | Percent | Number (in thousands) | Percent | Number (in thousands) | Percent | Number (in thousands) | |||||
| All | 9.0 | 7,608 | 3.6 | 2,721 | 3.1 | 2,588 | 1.0 | 730 | 1.8 | 1,483 | 0.5 | 379 | |||||
| AL | 5.8 | 66 | 1.7 | 17 | 2.3 | 26 | 0.4 | 4 | 0.3 | 3 | 0.0 | 0 | |||||
| AK | 6.4 | 13 | 2.6 | 4 | 1.8 | 4 | 0.6 | 1 | 0.0 | 0 | 0.0 | 0 | |||||
| AZ | 7.0 | 126 | 2.7 | 42 | 2.3 | 42 | 0.6 | 10 | 1.8 | 33 | 0.5 | 8 | |||||
| AR | 4.9 | 34 | 1.5 | 10 | 2.2 | 15 | 0.5 | 3 | 1.7 | 12 | 0.5 | 3 | |||||
| CA | 12.3 | 1,284 | 6.0 | 524 | 4.1 | 430 | 1.6 | 138 | 2.1 | 218 | 0.7 | 60 | |||||
| CO | 10.6 | 178 | 4.2 | 58 | 3.4 | 56 | 1.0 | 14 | 1.7 | 29 | 0.5 | 7 | |||||
| CT | 12.8 | 121 | 6.2 | 54 | 5.3 | 50 | 1.7 | 15 | 2.8 | 27 | 0.6 | 6 | |||||
| DE | 9.1 | 22 | 2.8 | 6 | 2.9 | 7 | 0.4 | 1 | 2.3 | 6 | 0.4 | 1 | |||||
| DC | 21.7 | 41 | 15.6 | 31 | 6.1 | 12 | 3.0 | 6 | 2.6 | 5 | 0.8 | 2 | |||||
| FL | 7.1 | 373 | 2.4 | 116 | 2.7 | 142 | 0.7 | 32 | 1.9 | 98 | 0.4 | 19 | |||||
| GA | 8.3 | 218 | 2.9 | 70 | 2.9 | 75 | 0.8 | 20 | 2.0 | 52 | 0.6 | 13 | |||||
| HI | 5.0 | 19 | 3.2 | 11 | 1.4 | 5 | 0.8 | 3 | 1.2 | 5 | 0.5 | 2 | |||||
| ID | 6.2 | 28 | 1.7 | 6 | 2.1 | 10 | 0.5 | 2 | 0.2 | 1 | 0.0 | 0 | |||||
| IL | 9.7 | 317 | 4.0 | 122 | 3.3 | 109 | 1.1 | 34 | 1.9 | 62 | 0.6 | 17 | |||||
| IN | 5.8 | 100 | 1.9 | 30 | 2.0 | 35 | 0.5 | 8 | 1.8 | 32 | 0.4 | 7 | |||||
| IA | 5.7 | 48 | 1.5 | 12 | 2.3 | 20 | 0.5 | 4 | 1.8 | 15 | 0.4 | 3 | |||||
| KS | 6.3 | 49 | 2.0 | 13 | 2.3 | 18 | 0.6 | 4 | 1.5 | 12 | 0.4 | 3 | |||||
| KY | 5.2 | 56 | 1.8 | 17 | 2.1 | 23 | 0.5 | 5 | 1.8 | 19 | 0.4 | 4 | |||||
| LA | 7.1 | 75 | 1.9 | 18 | 2.4 | 25 | 0.5 | 5 | 0.3 | 3 | 0.0 | 0 | |||||
| ME | 5.1 | 18 | 2.3 | 8 | 1.5 | 5 | 0.8 | 3 | 1.3 | 5 | 0.8 | 2 | |||||
| MD | 13.0 | 208 | 5.9 | 89 | 3.5 | 55 | 1.1 | 16 | 1.5 | 24 | 0.6 | 9 | |||||
| MA | 13.8 | 259 | 6.1 | 108 | 4.6 | 86 | 1.7 | 30 | 1.9 | 36 | 0.6 | 11 | |||||
| MI | 7.1 | 178 | 2.3 | 51 | 2.3 | 57 | 0.6 | 14 | 1.8 | 45 | 0.5 | 11 | |||||
| MN | 9.0 | 141 | 3.7 | 52 | 2.9 | 46 | 0.9 | 13 | 1.7 | 26 | 0.5 | 7 | |||||
| MS | 4.1 | 27 | 1.4 | 9 | 2.0 | 13 | 0.7 | 4 | 1.6 | 10 | 0.7 | 4 | |||||
| MO | 6.0 | 92 | 2.4 | 34 | 2.2 | 34 | 0.6 | 8 | 1.7 | 27 | 0.4 | 6 | |||||
| MT | 4.8 | 14 | 1.5 | 4 | 1.9 | 5 | 0.8 | 2 | 1.5 | 4 | 0.7 | 2 | |||||
| NE | 4.8 | 26 | 1.8 | 9 | 1.9 | 10 | 0.6 | 3 | 1.3 | 7 | 0.5 | 2 | |||||
| NV | 6.0 | 48 | 2.7 | 18 | 2.1 | 17 | 0.7 | 5 | 1.7 | 14 | 0.6 | 4 | |||||
| NH | 10.1 | 39 | 3.5 | 12 | 3.0 | 12 | 0.9 | 3 | 1.9 | 7 | 0.5 | 2 | |||||
| NJ | 15.5 | 366 | 6.2 | 131 | 5.3 | 126 | 1.5 | 33 | 2.3 | 56 | 0.5 | 11 | |||||
| NM | 5.1 | 25 | 2.2 | 10 | 2.0 | 10 | 0.9 | 4 | 0.1 | 0 | 0.0 | 0 | |||||
| NY | 11.8 | 580 | 6.0 | 277 | 4.5 | 222 | 1.8 | 83 | 2.3 | 111 | 0.7 | 34 | |||||
| NC | 7.2 | 187 | 2.6 | 62 | 2.5 | 65 | 0.7 | 16 | 1.6 | 43 | 0.4 | 9 | |||||
| ND | 6.7 | 15 | 2.3 | 4 | 2.6 | 6 | 0.7 | 1 | 2.2 | 5 | 0.7 | 1 | |||||
| OH | 6.5 | 192 | 2.2 | 58 | 2.3 | 68 | 0.6 | 16 | 1.8 | 53 | 0.5 | 13 | |||||
| OK | 5.6 | 55 | 1.8 | 15 | 2.1 | 20 | 0.7 | 6 | 1.7 | 16 | 0.7 | 6 | |||||
| OR | 8.0 | 87 | 3.1 | 30 | 2.6 | 28 | 0.8 | 8 | 1.6 | 17 | 0.5 | 5 | |||||
| PA | 8.1 | 265 | 3.0 | 90 | 2.6 | 85 | 0.9 | 26 | 1.5 | 49 | 0.5 | 16 | |||||
| RI | 7.7 | 21 | 2.9 | 8 | 2.6 | 7 | 0.6 | 2 | 1.4 | 4 | 0.4 | 1 | |||||
| SC | 6.5 | 81 | 1.9 | 22 | 2.3 | 28 | 0.5 | 6 | 1.8 | 22 | 0.4 | 4 | |||||
| SD | 5.8 | 14 | 1.4 | 3 | 1.8 | 4 | 0.5 | 1 | 1.1 | 3 | 0.5 | 1 | |||||
| TN | 6.7 | 114 | 2.3 | 35 | 2.7 | 46 | 0.8 | 12 | 1.6 | 28 | 0.5 | 7 | |||||
| TX | 8.6 | 655 | 3.0 | 188 | 2.8 | 211 | 0.8 | 53 | 1.5 | 118 | 0.5 | 30 | |||||
| UT | 8.0 | 71 | 1.9 | 13 | 2.8 | 25 | 0.5 | 4 | 1.9 | 17 | 0.2 | 2 | |||||
| VT | 5.6 | 10 | 1.9 | 3 | 2.0 | 3 | 0.5 | 1 | 1.6 | 3 | 0.2 | 0 | |||||
| VA | 12.0 | 273 | 5.0 | 104 | 3.0 | 69 | 0.9 | 19 | 1.8 | 41 | 0.5 | 11 | |||||
| WA | 12.4 | 258 | 4.7 | 81 | 3.6 | 74 | 1.2 | 20 | 1.5 | 32 | 0.4 | 7 | |||||
| WV | 4.2 | 17 | 1.5 | 5 | 1.7 | 7 | 0.8 | 3 | 0.0 | 0 | 0.0 | 0 | |||||
| WI | 6.0 | 94 | 1.8 | 26 | 2.2 | 35 | 0.5 | 7 | 1.7 | 26 | 0.3 | 5 | |||||
| WY | 6.2 | 10 | 1.2 | 2 | 2.2 | 3 | 0.6 | 281 | 1.6 | 2 | 0.5 | 1 | |||||
Source and notes: Author’s analysis of American Community Survey 2019 1-year Public Use Microdata Sample. To focus on workers with significant attachment to work, calculations exclude those who are younger than 16, those who worked fewer than 14 weeks in the preceding 12 months, and those who usually worked fewer than 10 hours per week. Percentages reflect to the share of workers with annual earnings above the indicated level for men and women, respectively, in each state. Earnings reported in the 2019 ACS are adjusted for inflation using the CBO projections for 2020 and 2021.
It is worth noting that those with wage and salary incomes that exceed the current cap are also more likely to have additional unearned income that escapes the payroll tax altogether. Only 7.7 percent of those whose entire wage and salary earnings are subject to the payroll tax report additional income from investments, dividends, and rentals (Table 11), excluding income from retirement accounts. By contrast, over a third of those with annual earnings above $250,000 have additional unearned income of this nature, as do two-in-five of those earning above $400,000 per year. The average amount of unearned rental, investment, and dividend income is also much higher for those whose earned income exceeds the payroll tax cap. This means that those who would be directly affected by modifications to the taxable maximum are also more likely to be buttressed by additional income streams that were never subject to payroll taxes at all.
| Annual Earnings | Percent | Number (in thousands) | Average Annual Unearned Income from Investments, Dividends, and Rentals |
|---|---|---|---|
| $142,800 or less | 7.7 | 11,498 | $12,100 |
| Between $142,800 and $250,000 | 27.4 | 1,924 | $16,596 |
| Between $250,000 and $400,000 | 34.5 | 501 | $28,707 |
| Over $400,000 | 40.0 | 744 | $49,276 |
Source and notes: Author’s analysis of American Community Survey 2019 1-year Public Use Microdata Sample. To focus on workers with significant attachment to work, calculations exclude those who are younger than 16, those who worked fewer than 14 weeks in the preceding 12 months, and those who usually worked fewer than 10 hours per week. Percentages reflect the share of workers with unearned income from investments, dividends, and rentals in each earned income bracket . Earnings reported in the 2019 ACS are adjusted for inflation using the CBO projections for 2020 and 2021.
While the percentage of workers with earnings above the payroll tax cap has remained low, the overall share of earnings going above the cap is troublingly high. Over the last four decades, upward redistribution of income has weakened Social Security’s finances by redirecting a larger share of earnings to those who make more than the taxable maximum, rather than to those whose earnings are fully taxable (Brown & Baker, 2020). Modifying or eliminating the cap would blunt the impact of wage inequality on the program’s solvency.
Opponents may argue that higher earners should be able to collect additional monies proportional to what they have contributed. Historically, Social Security’s taxable earnings maximum has informed both the level of contributions made by workers and the level of benefit payouts to retirees. Proponents of privatization take this line of thinking even further, arguing that the trust should be replaced by private individual accounts. However, this largely misunderstands the program’s function as a form of social insurance that keeps seniors out of poverty and insulates them from the worst effects of the upward income redistribution mentioned above. Workers who pay into social security are paying into insurance for society as a whole, not just for themselves as individuals. With the demise of private sector pensions (Morrissey, 2013) and the failure of wages to keep pace with soaring health care and housing costs (Miller, 2021; Guida & O’Donnell, 2021), the share of retirees for whom Social Security is an indispensable lifeline is likely to increase. To ensure that this lifeline remains robust, legislators must act swiftly to compel the richest Americans to pay their fair share.
Barber, A., & Brown, H. (2019). Who Pays if We Modify the Social Security Payroll Tax Cap? (p. 9). Center for Economic and Policy Research. https://cepr.net/images/stories/reports/ss-cap-update-2019-02.pdf?v=2
Bernie Sanders Re-Introduces His Bill to Expand Social Security. (2019, February 14). National Committee to Preserve Social Security and Medicare. https://www.ncpssm.org/entitledtoknow/bernie-sanders-re-introduces-his-bill-to-expand-social-security/
Brown, H., & Baker, D. (2020). The Impact of Upward Redistribution on Social Security Solvency (2020 Update). Center for Economic and Policy Research. https://cepr.net/the-impact-of-upward-redistribution-on-social-security-solvency-2020-update/
Guida, V., & O’Donnell, K. (2021, July 11). The soaring market that threatens to derail the economic recovery. Politico. https://www.politico.com/news/2021/07/11/housing-market-inflation-biden-recovery-499027
H.R.860—116th Congress (2019-2020): Social Security 2100 Act, H.R.860, House, 116th Congress (2019). https://www.congress.gov/bill/116th-congress/house-bill/860
Konish, L. (2021, April 30). What Biden’s latest moves could signal for Social Security reform. CNBC. https://www.cnbc.com/2021/04/30/what-bidens-latest-moves-could-signal-for-social-security-reform.html
Miller, S. (2021, June 29). Inflation, Other Factors, Drive Up Health Care Costs. SHRM. https://www.shrm.org/resourcesandtools/hr-topics/benefits/pages/rising-inflation-will-affect-health-care-costs.aspx
Morrissey, M. (2013). Private-sector pension coverage fell by half over two decades (Working Economics Blog). Economic Policy Institute. https://www.epi.org/blog/private-sector-pension-coverage-decline/
Newport, F. (2019). Social Security and American Public Opinion (Polling Matters). Gallup. https://news.gallup.com/opinion/polling-matters/258335/social-security-american-public-opinion.aspx
Rawlins, S. (2020). Social Security is Strong and it Deserves More Support. Center for Economic and Policy Research. https://cepr.net/social-security-is-strong-and-it-deserves-more-support/
Rawlins, S. (2021). Wage Cap Allows Millionaires to Stop Contributing to Social Security on February 23, 2021. Center for Economic and Policy Research. https://cepr.net/ss-payroll-tax-2021/
Romig, K. (2020a). Trump Budget Would Hurt Older Americans | Center on Budget and Policy Priorities (Off the Charts: Policy Insight Beyond the Numbers) [Center on Budget and Policy Priorities]. Center on Budget and Policy Priorities. https://www.cbpp.org/blog/trump-budget-would-hurt-older-americans-1
Romig, K. (2020b). Social Security Lifts More Americans Above Poverty Than Any Other Program | Center on Budget and Policy Priorities. Center on Budget and Policy Priorities. https://www.cbpp.org/sites/default/files/atoms/files/10-25-13ss.pdf
Social Security Act, 42 U.S.C. §§ 301-1305 (Suppl. 4 1934) (1935). https://www.ssa.gov/OP_Home/ssact/ssact-toc.htm
The 2020 Annual Report of the Board of Trustees of the Federal Old-Age and Survivors Insurance and Federal Disability Insurance Trust Funds. (n.d.). Retrieved August 11, 2021, from https://www.ssa.gov/oact/tr/2020/
The Budget and Economic Outlook: 2020 to 2030. (2020). Congressional Budget Office. https://www.cbo.gov/publication/56073
To Build Back Better, Scrap the Social Security Cap. (2021, February 23). Center for Economic and Policy Reearch. https://cepr.net/press-release/to-build-back-better-scrap-the-social-security-cap/
