Report
Special Drawing Rights Could Help Recover Millions of Export-Related US Jobs, and Create Even More

Report
The author wishes to thank Alexander Main, Annee Lorentzen, Brett Heinz, Dan Beeton, and Mark Weisbrot.
This paper examines the effect of the COVID-19 pandemic, and the resulting world recession, on American export-related jobs. It argues that an additional, and larger, issuance of Special Drawing Rights — reserve assets at the International Monetary Fund — would help bring those jobs back and create more.
Since the beginning of the pandemic, lockdowns and other containment measures as well as their effects on certain sectors of the US economy, have been the focus of much analysis. Millions of jobs were lost as businesses that focused on, for example, the retail trade and tourism, shuttered.
One less examined aspect of the pandemic has been the effect of declining external aggregate demand on American industries and sectors that depend on exports. Not only were these businesses hurt by containment measures and other effects of the virus in the United States itself, they have faced reduced demand for their goods and services from the rest of the world.
Many low- and middle-income countries have experienced more severe economic crises due to the pandemic than high-income countries, and thus have imported less from countries like the United States. This has led to the temporary loss of millions of export-related jobs in the United States.
This fall-off in demand also means that rate of the return of American export-related jobs — jobs both directly and indirectly involved in the production of exports — is dependent upon a broad economic recovery in the rest of the world.
Special Drawing Rights, which are cost-free for the United States, can help boost global demand for American exports by improving the financial position of low- and middle-income countries. Increased demand for American exports would bring back these export-related jobs back more quickly, as well as put the US economy on a path to creating more export-related jobs over the next five years. The US economy is still down about 6.5 million jobs from its pre-pandemic level of employment, and 9.2 million below the pre-pandemic trend.
This paper’s findings include:
Much of the analysis of the economic effects of the COVID-19 pandemic in the United States has focused on the impact of local and state containment and social distancing measures on broad sectors of the economy, particularly on the retail and services sectors, and the millions of jobs that were lost as a result of these measures. There has been far less discussion, however, of the significant decline in US export earnings prompted by the dire economic effects of the pandemic in the rest of the world, and the high number of export-related jobs that have been lost in the United States as a result. The following issue brief looks at how the global pandemic has led to significant losses of jobs in the US economy, and how International Monetary Fund (IMF) reserve assets known as Special Drawing Rights (SDRs) can help boost global demand for American exports and bring these jobs back more quickly, as well as put the US economy on a path to creating more export-related jobs over the next five years.
In 2019, exports from the United States were valued at nearly $2.27 trillion: over $1.39 trillion worth of goods and over $876 billion worth of services.1 Due to the ongoing effects of the pandemic and world recession, American exports have been lower than the 2019 baseline in almost every month since January 2020, with a significant recovery of exports in goods in the most recent three months.
In 2020, total exports declined by 16.0 percent to $1.91 trillion. Disaggregated, exports in goods fell to $1.20 trillion (a 13.8 percent decline) while exports in services dropped to $705 billion (a 19.5 percent decline). Compared to 2019, exports in 2020 dropped by over $362 billion (a $192 billion loss in goods exports and a $171 billion loss in services exports). Including the latest available 2021 data, this represents a total loss of about $429 billion — over $189 billion in goods exports and nearly $240 billion in services exports (Table 1).2(See Appendix Table A1 for monthly export data.)
| Value of US Exports | Difference from 2019 Baseline | ||||||
|---|---|---|---|---|---|---|---|
| Period | Total | Goods | Services | Total | Goods | Services | |
| Pre-Pandemic | |||||||
| 2019 annual data | $2,268,696 | $1,392,401 | $876,295 | n.a. | n.a. | n.a. | |
| Pandemic | |||||||
| 2020 annual data | $1,906,458 | $1,200,815 | $705,643 | $362,238 | $191,586 | $170,652 | |
| January to May 2021 | $878,347 | $582,371 | $295,976 | $66,943 | -$2,204 | $69,147 | |
| Estimated Value of Lost US Exports Due to the Pandemic and World Recession in Total (millions USD) | $429,181 | $189,382 | $239,799 | ||||
Sources: US Census Bureau Foreign Trade Division (2021), USA Trade Online (N.d.), and author’s calculations.
It is also possible to estimate the loss of jobs associated with this decline in exports. Based on the latest available report from the Department of Commerce’s International Trade Administration, $1 billion of exports of goods, on average, supports 4,670 jobs, and $1 billion of exports of services supports 5,539 jobs. This means that a total of over 10.7 million jobs are supported by the US export industry: about 3.5 million from goods exports, and about 7.3 million from services exports.3
The Department of Commerce’s analysis implies that the loss of exports from the pandemic and world recession resulted in a loss of over 1.8 million jobs in 2020. Including 2021 data, this number reaches over 2.2 million jobs; about 884,000 from the loss of goods exports and about 1.3 million from the loss of services exports (Table 2).4
| Total | Goods | Services | |
|---|---|---|---|
| Estimated Value of Lost US Exports in 2020 (billions USD) | $362.238 | $191.586 | $170.652 |
| Estimated Value of Lost US Exports in Total (billions USD) | $429.181 | $189.382 | $239.799 |
| Number of Jobs Supported by $1 Billion in Exports at the National Level | n.a. | 4,670 | 5,539 |
| Implied Loss of Jobs in 2020 | 1,839,948 | 894,707 | 945,241 |
| Implied Loss of Jobs in Total | 2,212,659 | 884,413 | 1,328,246 |
Sources and notes: International Trade Administration (2019), USA Trade Online (N.d.), US Census Bureau Foreign Trade Division (2021), and author’s calculations. See notes in text.
It is possible to get a sense of the importance of exports to employment in specific US states (as well as Puerto Rico and the US Virgin Islands) from data on goods exports.5 Figure 1 shows that, as a share of total pre-pandemic employment, exports of goods in 2019 were most important to Alaska (export-related jobs represent 11.5 percent of the state’s employment); Puerto Rico (9.5 percent); North Dakota (8.9 percent); Louisiana (8.8 percent); and Texas (8.7 percent).
In the overall number of jobs supported by exports, Texas had the most at 1.1 million, followed by California (677,000), Illinois (290,000), New York (260,000), and Michigan (249,000). The states with the highest value of goods exported in 2019 were Texas with $288 billion, followed by California, New York, Louisiana, and Washington State. (See Appendix Table A2.)
From January 2020 to May 2021 — during the pandemic — all but 11 state-level jurisdictions saw declines in exports of goods (see Box 1 for a discussion related to these 11 jurisdictions). Texas lost a total of nearly $43 billion in exports in goods, followed by Washington State ($22 billion), California ($17 billion), South Carolina ($14 billion), and Michigan ($12 billion). (See Appendix Table A3 for more information.)
Figure 1
Percent of Total Employment Supported by Goods Exports, by State-Level Jurisdiction, 2019
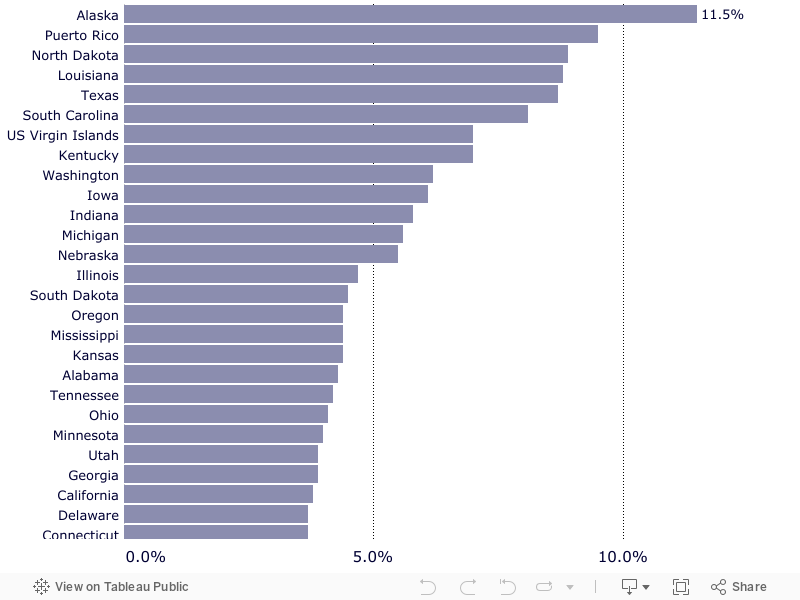
Figure 2 shows the implied losses of jobs, due to declines in exports of goods, by state-level jurisdiction. In terms of total export-related job loss, Texas was hardest hit, with 167,000 jobs lost, followed by Washington State (90,000 jobs), California (74,000 jobs), South Carolina (68,000 jobs), and Michigan (62,000 jobs). As a share of January 2020 total state employment levels (as shown in Appendix Table A3), South Carolina had the largest drop (3.1 percent), followed by Puerto Rico (2.7 percent), North Dakota (2.7 percent), Washington State (2.6 percent), and Kentucky (2.4 percent).
Figure 2
Implied Loss of Jobs Due to a Decline in Goods Exports During the Pandemic and World Recession, by State-Level Jurisdiction, January 2020–May 2021
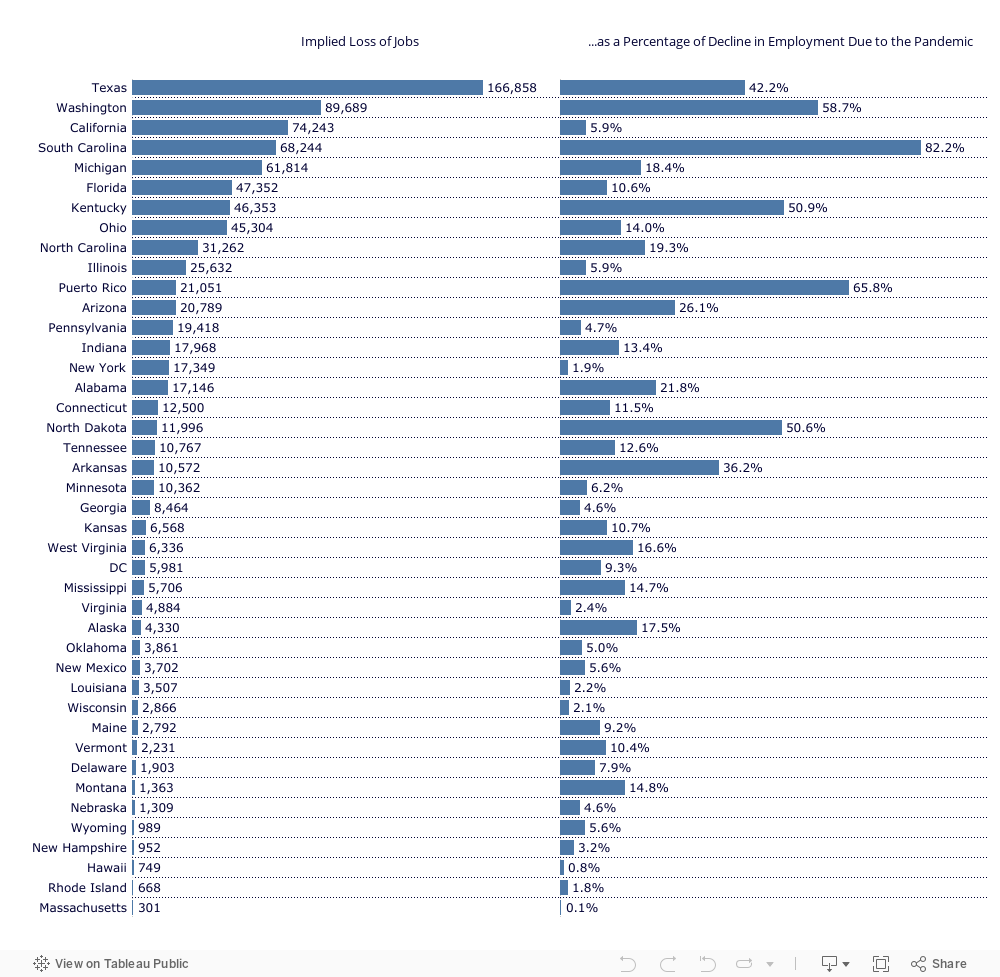
The implied loss of jobs based on the cumulative loss of exports in goods throughout the pandemic can also be compared to the remaining gap in employment due to the pandemic. For example, employment in South Carolina in May 2021 is still down by 83,000 jobs compared to January 2020 levels. As shown in Figure 2, implied loss of jobs due to lost exports of goods represents over 82 percent of this total number of lost jobs, suggesting that a rebound in just exports of goods in South Carolina would close most of the remaining gap in employment due to the pandemic. This is a similar story for Puerto Rico (66 percent), Washington State (59 percent), Kentucky (51 percent), and North Dakota (51 percent).6
Many of the jobs lost due to a decline in US exports will eventually return as the global economy recovers. However, if jobs return at a faster pace, it will have greater benefits for the United States.
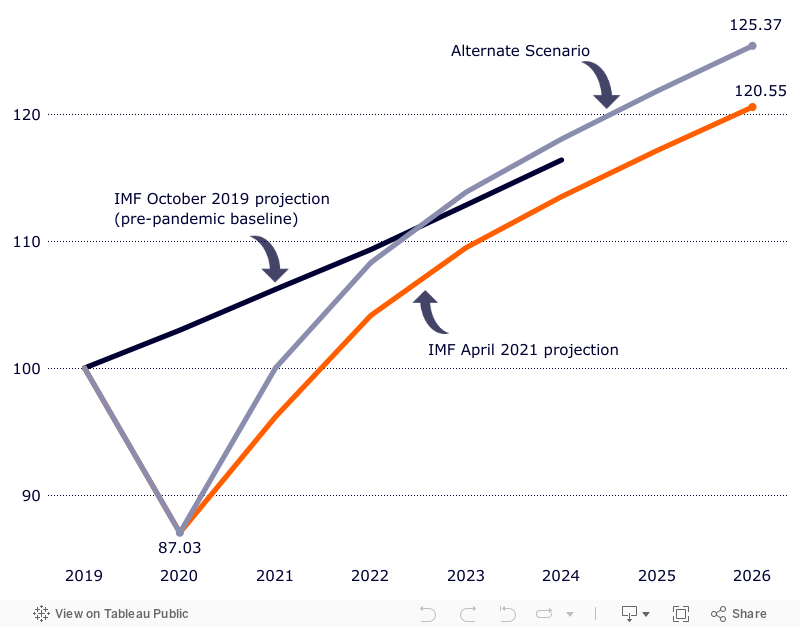
It is thus instructive to look at the potential future job gains from a faster recovery and the subsequent growth in exports using a simple analysis. Figure 3 shows projections, from the IMF, for the growth in the volume of US exports in goods and services in October 2019 (pre-pandemic) and in April 2021, as well as an Alternate Scenario where exports fully recover to 2019 levels in 2021 and grow at the same rates as in the April 2021 projection in subsequent years.7 As can be seen, the IMF’s April 2021 projections remain below the pre-pandemic trend until 2024, the last year with available data. In the Alternate Scenario, exports surpass the pre-pandemic trend in 2023, meaning that all the losses from the pandemic have been recovered at that point.
If it is assumed that these projections in the volume of exports roughly translate to projections in the value of exports in both goods and services, Table 3 shows the value of exports by year under the different projections as well as implied jobs gains from the Alternate Scenario. This demonstrates how valuable a more robust initial recovery of exports in 2021 would be, as it puts the United States on a path to hundreds of thousands more jobs than projected, with about 550,000 more jobs gained in total by 2026.8
Figure 3
Index of Projections of the Volume of American Exports in Goods and Services, 2019–2026
| Year | Value of Exports, October 2019 Projection | Value of Exports, April 2021 Projection | Value of Exports, Alternate Scenario | Difference in Values of Exports between Alternate Scenario and April 2021 Projection | Implied Job Gains from Alternate Scenario |
|---|---|---|---|---|---|
| 2019 | $2,268,696 | $2,268,696 | $2,268,696 | $0 | 0 |
| 2020 | $2,336,349 | $1,906,458 | $1,906,458 | $0 | 0 |
| 2021 | $2,409,313 | $2,181,487 | $2,268,696 | $87,209 | 436,540 |
| 2022 | $2,480,315 | $2,362,615 | $2,457,066 | $94,450 | 472,786 |
| 2023 | $2,560,008 | $2,483,794 | $2,583,089 | $99,295 | 497,036 |
| 2024 | $2,640,366 | $2,574,850 | $2,677,785 | $102,935 | 515,257 |
| 2025 | n.a | $2,657,348 | $2,763,581 | $106,233 | 531,766 |
| 2026 | n.a | $2,734,996 | $2,844,333 | $109,337 | 547,304 |
Sources and notes: IMF (2019), IMF (2021), International Trade Administration (2020), and author’s calculations. Estimates for the October 2019 projection start after 2018. Estimates for the April 2021 and Alternate Scenario projections start after 2020. It is assumed that projections for the volume of exports roughly translate to the value of exports in both goods and services. Implied job gains use the 2019 national estimates for jobs supported by $1 billion in exports, separately for goods and services. See text.
The losses of jobs discussed here are not due to the pandemic or recession within the United States but due to the loss of demand for exports from the rest of the world. As discussed earlier, many of these jobs will come back as the world economy recovers, and the faster it recovers, the more jobs will be created in the United States, and the sooner they will be created.
An issuance of Special Drawing Rights (SDRs) by the International Monetary Fund (IMF) would provide a significant boost to the recovery of the world economy, especially by providing support to low- to middle-income countries. SDRs are a reserve asset issued by the IMF to its member countries. These reserve assets can be exchanged, usually by low- and middle-income countries, for hard currency, like the euro or dollar, if need can be shown. SDRs are a unique tool because they can be issued relatively quickly, they do not cost any country anything and they are not loans. They also do not have any conditions, for example about the recipient country’s macroeconomic policies, attached to them.9
More specifically, SDRs would boost the world economy by helping prevent and mitigate economic crises, including balance of payments crises, fiscal crises, and debt crises. They play this role even when they are not converted to hard currency because they provide developing countries with supplemental international reserves; this also lowers countries’ borrowing costs.10 It would also help countries access resources to help them tackle the pandemic sooner, and thereby allowing them to achieve a faster and more complete recovery, as well as saving many lives. In turn this allows countries to bolster domestic demand and purchase a greater quantity of imports from the United States more quickly than they would without the additional SDRs.
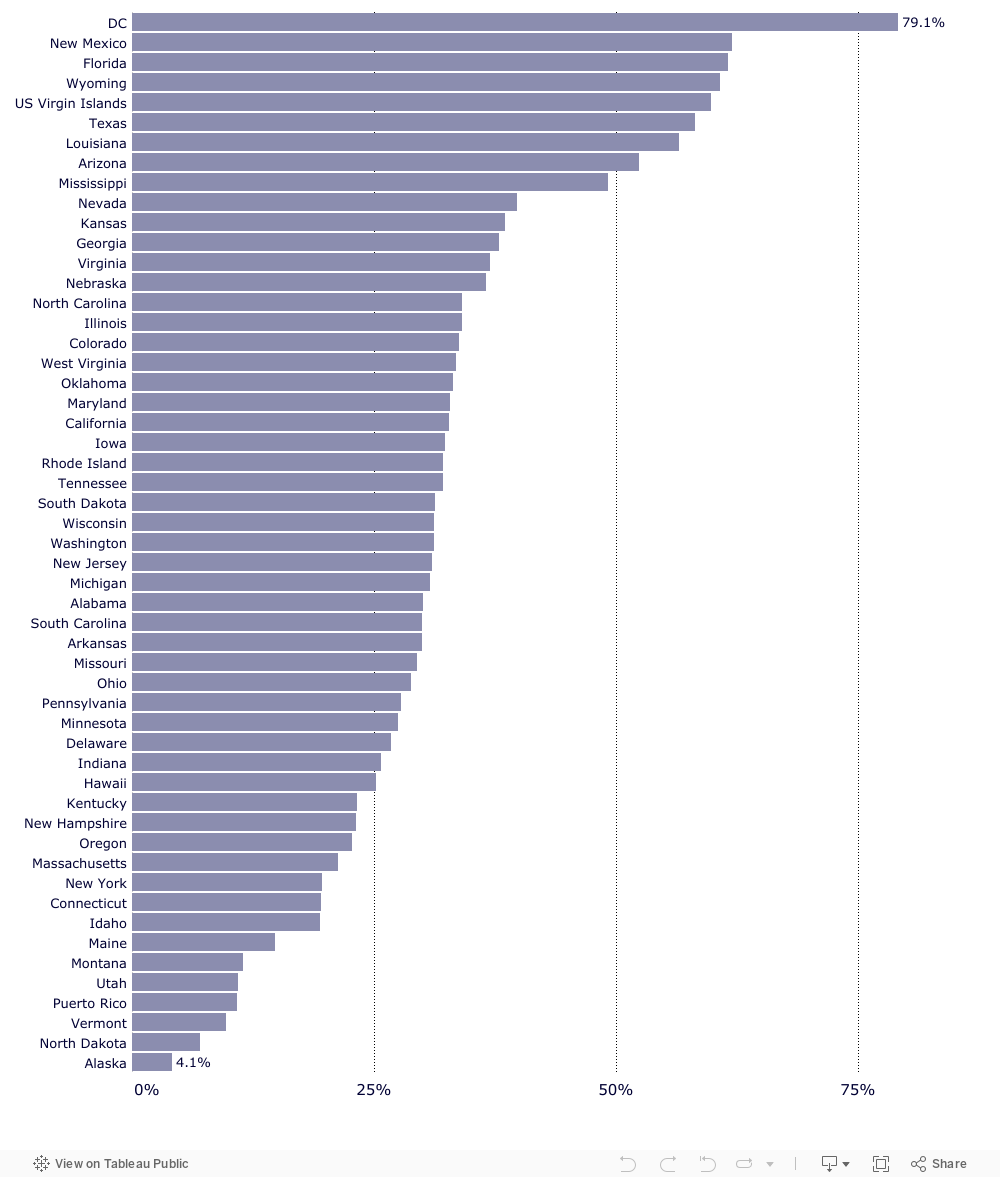
Figure 4 shows that low- and middle-income economies import a significant amount of goods from most US states, illustrating the importance of an economic recovery in low- and middle-income economies to the health of specific US states’ economies. In 2019, the value of goods exports to low- and middle-income economies, excluding China, represented 79 percent of the District of Columbia’s total, 62 percent of New Mexico’s, 62 percent of Florida’s, 61 percent of Wyoming’s, and 60 percent of the US Virgin Islands’.
Figure 4
Share of Value of Goods Exports to Low- and Middle-Income Economies, Excluding China, by State-Level Jurisdiction, 2019
Although the US Treasury Department has recently agreed to support an IMF issuance of $650 billion worth of SDRs — a positive and commendable move — this amount is significantly less than legislation supporting a 2 trillion SDR issuance, which was passed twice by the House of Representatives in 2020, and was introduced in the House and Senate in 2021.11 S&P Global Ratings estimates also indicate that an issuance of $650 billion worth of SDRs will fall short of poor countries’ reserve needs.12
For these reasons, an additional issuance of SDRs should be a priority for the IMF as well as for the Biden administration and other IMF member governments if they want to ensure a robust recovery of the global economy.
Arnold, Tom. 2021. “IMF’s SDR Cash Will Still Leave Poorest Nations Short, S&P Says.” Reuters, June 22. https://www.reuters.com/business/five-emerging-markets-benefit-most-imfs-sdr-move-sp-2021-06-22/
Center for Economic and Policy Research. 2021a. “Republican Senate Leadership on IMF Special Drawing Rights (SDRs): A Fact-Check.” Washington, DC: Center for Economic and Policy Research, June 21. https://cepr.shorthandstories.com/fact-check-sdrs/index.html
______. 2021b. “IMF’s Planned Special Drawing Rights Allocation ‘A Good First Step,’ CEPR Co-Director Says.” Washington, DC: Center for Economic and Policy Research, April 14. https://cepr.net/press-release/imfs-planned-special-drawing-rights-allocation-a-good-first-step-cepr-co-director-says/
International Monetary Fund (IMF). 2019. “World Economic Outlook Database, October 2019 Edition.” https://www.imf.org/en/Publications/WEO/weo-database/2019/October
______. 2021a. “World Economic Outlook Database, April 2021 Edition.” https://www.imf.org/en/Publications/WEO/weo-database/2021/April
______. 2021b. “World Economic Outlook: Managing Divergent Recoveries.” April. https://www.imf.org/en/Publications/WEO/Issues/2021/03/23/world-economic-outlook-april-2021
International Trade Administration. 2020. “Jobs Supported by Exports 2019 Update.” US Department of Commerce, December. https://www.trade.gov/feature-article/otea-publications#:~:text=Jobs%20Supported%20by%20Exports%202019%20Update%20%5B46KB%5D
______. 2021. “Jobs Supported by State Exports 2019.” US Department of Commerce, February. https://www.trade.gov/sites/default/files/2021-02/Jobs%20Supported%20by%20State%20Exports%202019_0.xlsx
Jacobs, Didier, Alexander Main, and Mark Weisbrot. 2020. “The World Economy Needs a Stimulus: IMF Special Drawing Rights Are Critical to Containing the Pandemic and Boosting the World Economy.” Washington, DC: Center for Economic and Policy Research, June 22. https://cepr.net/publications/the-world-economy-needs-a-stimulus-imf-special-drawing-rights-are-critical-to-containing-the-pandemic-and-boosting-the-world-economy/
Rasmussen, Chris. 2020. “Jobs Supported by Exports Methodology.” US Department of Commerce, International Trade Administration, December. https://www.trade.gov/sites/default/files/2020-12/Jobs%20Supported%20by%20Exports%20Methodology.pdf
United Nations Conference on Trade and Development (UNCTAD). 2021. “Global Trade Update.” May. https://unctad.org/system/files/official-document/ditcinf2021d2_en.pdf
US Bureau of Labor Statistics. 2021. “State and Metro Area Employment, Hours, & Earnings.” US Department of Labor. https://www.bls.gov/sae/data/
US Census Bureau. 2005. “USATrade Online Technical Documentation.” November 21. https://www.census.gov/foreign-trade/reference/guides/methodology/usatradeonline-port-tech.html
______. N.d. “State Exports from New Jersey.” https://www.census.gov/foreign-trade/statistics/state/data/nj.html
US Census Bureau Foreign Trade Division. 2021. “US International Trade in Goods and Services, 1992-Present.” https://www.census.gov/foreign-trade/statistics/historical/exhibit_history.pdf
USA Trade Online. N.d. United States Census Bureau. https://usatrade.census.gov/
Article


Article