

September 10, 2009

Nearly every demographic group and region tracked in the Census report experienced significant income declines, and no group experienced significant income gains.
By Shawn Fremstad
September 10, 2009
Today the Census Bureau released a report on the trends in income, including poverty, and health insurance between 2007 and 2008. The report shows that working-class and middle-class families were particularly hard hit by the recession that began in December 2007. The decline in real median income between 2007 and 2008 is the largest single-year decline in the 40 years of household median income data on record and the 60 years of family median income data on record.
The report also shows declines in health insurance coverage among middle-income families earning between $50,000 and $75,000. A key issue in health care reform is whether to provide insurance subsidies to people with incomes between 300 and 400 percent of the federal poverty threshold, many of which are within this $50,000 to $75,000 income band.
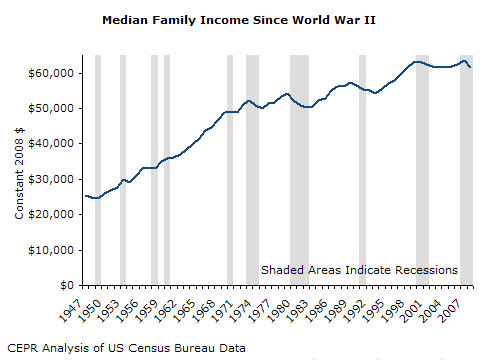
Median Income
Real median household income fell by 3.6 percent between 2007 and 2008, from $52,163 to $50,303.In addition to being the largest single-year decline in the last 40 years, this one-year decline is roughly equal to the three-year declinesthat occurred between 1999 and 2002 (a period that included the March 2001 to November 2001 recession), and 1989 to 1991 (a period that included the July 1990 to March 1991 recession).
Nearly every demographic group and region tracked in the Census report experienced significant income declines, and no group experienced significant income gains. Among the hardest hit were:
- Hispanic households, who experienced a 5.6 percent decline in median income
- Households headed by people between age 45 to 54, who experienced a 5.4 percent decline in median income
- Households headed by immigrants (including naturalized citizens) who experienced a 5.3 percent decline
- Households in the South and Midwest, who experienced declines of 4.9 percent and 4 percent respectively
The share of individuals aged 15 and over working full-time, year-round declined by 3.3 percentage points for men, from 74.5 percent in 2007 to 71.2 percent in 2008, and 2.2 percent for women, from 61.4 percent to 59.2 percent. The income declines, however, were not solely due to increases in unemployment and hours worked. Among workers who were employed full-time for the entire year, inflation-adjusted earnings fell by 1 percent for men and 1.9 percent for women.
Income Poverty
Consistent with the across-the-board declines in income, the percentage of people living below the official poverty threshold ($10,991 in 2008 for a one-person family unit and $21,834 for a two-parent, two-child family) increased from 12.5 percent in 2007 to 13.2 percent in 2008. The number of people experiencing poverty increased by 2.5 million—from 37.3 million to 39.8 million.
Increases in poverty were also widespread among the demographic groups and regions tracked in the Census report, although statistically significant changes were not quite as widespread as for income. Of particular note:
- Among people age 16 or older who worked during the year, the poverty rate increased by 5.7 percent to 6.4 percent—roughly 1 million workers—accounting for some 40 percent of the 2.5 million more people who experienced poverty in 2008.
- Among families of two or more people, the poverty rate increased from 9.8 percent to 10.3 percent, or 525,000 families. Most of these families (412,000) were married couple families—the smaller increases in poverty rates for female-headed and male-headed households with no spouses present were not statistically significant.
- Among racial and ethnic groups, poverty increased for Asians (from 10.2 to 11.8), Hispanics of any race (from 21.5 to 23.2), and White, not Hispanic (from 8.2 to 8.6).
Health Insurance
The number of people with employment-based or other private health insurance coverage declined by 1 million between 2007 and 2008. This was partially offset by increases in public health insurance coverage. Overall, the number of uninsured people increased by 682,000—from 45,657 million to 46,340 million; there was no statistically significant change in the rate of uninsurance (15.4 percent in 2008).
Some groups tracked in the Census report did experience significant declines in coverage rates, including children (a 1.1 percentage point decline) and especially young children (under age 6), who experienced a 1.8 percentage point decline in coverage, and Hispanics (a 1.4 percentage point decline).
Of particular note, households with incomes between $50,000 and $75,000 were the only income group to experience a significant decline in coverage (0.6 percentage points). A key issue on health care reform is whether to provide subsidies to people with incomes between 300 and 400 percent of the federal poverty threshold, many of whom are within this $50,000 to $75,000 band.
Shawn Fremstad is Director of Bridging the Gaps at the Center for Economic and Policy Research in Washington, DC. CEPR’s Poverty Byte is published each year upon release of the Census income report. For more information or to subscribe by fax or email contact CEPR at 202-293-5380 ext. 103 or warner at cepr dot net.

