

August 10, 2016
One of the most striking aspects of the 2008–2009 recession was the rise in involuntary part-time employment. In 2007, involuntary part-time employment — the condition of working a part-time job while seeking a full-time one — was just 3.0 percent of total employment. The rate peaked at 6.7 percent in March 2010 and has averaged 4.0 percent through the first six months of 2016.
This is important for two reasons. First, it is a source of labor market weakness that results in a significant loss of income for many workers. Over 6 million people are working part-time involuntarily, and on average they work 23 hours per week. Because full-time workers are typically employed 42–43 hours per week, this is effectively a wage cut of almost 50 percent for the affected workers. When the labor market fully recovers from the recession, over 1.5 million involuntary part-time workers will be moved to full-time hours.
Second, today’s relatively high rate of involuntary part-time employment stands as evidence that the unemployment rate is overstating the strength of the economy. Currently the unemployment rate is 4.9 percent, just slightly above the pre-recession rate of 4.6 percent. This implies that the economy has almost fully recovered since unemployment peaked at 10.0 percent in October 2009. However, the unemployment rate falls when the unemployed stop searching for work, and given how many of the unemployed gave up on finding a job during the recession, it is clear that the unemployment rate is failing to pick up on a large number of jobless Americans who would like to work. The involuntary part-time employment rate, by contrast, is not subject to this bias.
To illustrate this point, Table 1 compares the rate of involuntary part-time employment for the year ending in May 2016 with two other periods with a similar unemployment rate. Between June 2015 and May 2016, the unemployment rate averaged 5.0 percent; between 2000 and the recession, there were two other periods with the same unemployment rate. (We start with the year 2000 because much of the demographic data on involuntary part-time employment only go back to 2000.) Those two periods were March 2001 to February 2002 and February 2005 to January 2006. If the unemployment rate were painting an accurate picture of the labor market, we’d expect the current involuntary part-time employment rate to be about the same as during the two previous periods.
Instead, involuntary part-time employment appears elevated relative to other periods with the same unemployment rate. An unemployment rate of 5.0 percent typically corresponds with an involuntary part-time employment rate of about 3.0 percent; but between June 2015 and May 2016, involuntary part-time employment averaged 4.2 percent. This discrepancy shows up for every demographic group.
Involuntary part-time employment is up the most among younger workers. While involuntary part-time employment has increased 1.2 percentage points for the workforce as a whole, it has increased 2.8 percentage points for 20–24 year-olds and 1.8 percentage points for 16–19 year-olds. The results are more equal across genders than across age groups, though involuntary part-time employment is up slightly more for women (+1.4 percentage points) than for men (+1.0 percentage point). There are greater discrepancies by race, with the increase of 1.8 percentage points for black workers by far the largest. Not surprisingly, when we break down the results by gender and race, we see that involuntary part-time employment is up the most among black women (+2.0 percentage points), with above-average increases also being experienced by black men (+1.5 percentage points), Latino women (+1.4 percentage points), and white women (+1.3 percentage points).
TABLE 1
Involuntary Part-Time Employment as Share of Nonagricultural Employment
| March 2001 to February 2002 | February 2005 to January 2006 | Average of Two Periods | June 2015 to May 2016 | Percentage-Point Increase | |
|---|---|---|---|---|---|
| Total | 2.9% | 3.2% | 3.0% | 4.2% | +1.2 ppt. |
| Gender | |||||
| Men | 2.8% | 3.0% | 2.9% | 3.9% | +1.0 ppt. |
| Women | 3.1% | 3.4% | 3.2% | 4.6% | +1.4 ppt. |
| Race | |||||
| White | 2.8% | 3.0% | 2.9% | 4.0% | +1.1 ppt. |
| Black | 4.0% | 4.4% | 4.2% | 5.9% | +1.8 ppt. |
| Latino | 5.2% | 5.0% | 5.1% | 6.3% | +1.2 ppt. |
| Asian | 2.7% | 2.5% | 2.6% | 3.1% | +0.4 ppt. |
| Age | |||||
| 16 to 19 | 5.6% | 5.4% | 5.5% | 7.3% | +1.8 ppt. |
| 20 to 24 | 5.2% | 5.9% | 5.5% | 8.3% | +2.8 ppt. |
| 25 to 54 | 2.6% | 2.8% | 2.7% | 3.8% | +1.2 ppt. |
| 55 and Over | 2.2% | 2.4% | 2.3% | 3.2% | +0.9 ppt. |
| Gender and Race | |||||
| White Men | 2.7% | 2.9% | 2.8% | 3.8% | +1.0 ppt. |
| White Women | 2.9% | 3.2% | 3.0% | 4.3% | +1.3 ppt. |
| Black Men | 3.9% | 4.0% | 4.0% | 5.5% | +1.5 ppt. |
| Black Women | 4.0% | 4.7% | 4.4% | 6.3% | +2.0 ppt. |
| Latino Men | 4.9% | 4.9% | 4.9% | 5.9% | +1.0 ppt. |
| Latino Women | 5.5% | 5.2% | 5.4% | 6.8% | +1.4 ppt. |
| Asian Men | 2.5% | 2.2% | 2.3% | 2.9% | +0.6 ppt. |
| Asian Women | 3.0% | 2.9% | 3.0% | 3.2% | +0.3 ppt. |
It is also notable that the length of the average workweek is down for all the demographic groups discussed above, with the exceptions of workers age 55 and older (up 0.3 hours) and white women (no change).
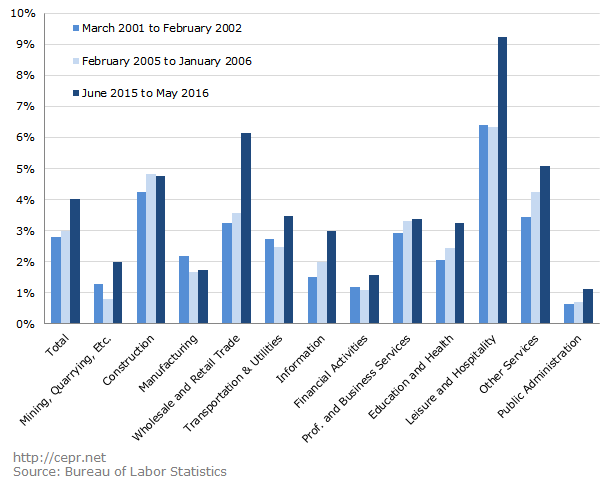
Table 2 below shows involuntary part-time employment rates for wage and salary workers by industry. Among wage and salary workers, involuntary part-time employment is about 1.1 percentage points higher than we should expect. It is up in 11 out of 12 industries; the exception is manufacturing, which has experienced only a small 0.2 percentage- point decrease. The largest increases have come in Leisure & Hospitality (+2.8 percentage points) and Wholesale & Retail Trade (+2.7 percentage points). And in the Mining & Quarrying industry, involuntary part-time employment has fully doubled.
TABLE 2
Involuntary Part-Time Employment by Industry, Wage and Salary Workers
| March 2001 to February 2002 | February 2005 to January 2006 | Average of Two Periods | June 2015 to May 2016 | Percentage-Point Increase | |
|---|---|---|---|---|---|
| Total | 2.8% | 3.0% | 2.9% | 4.0% | +1.1 ppt. |
| Mining, Quarrying, Etc. | 1.3% | 0.8% | 1.0% | 2.0% | +0.9 ppt. |
| Construction | 4.3% | 4.8% | 4.5% | 4.8% | +0.2 ppt. |
| Manufacturing | 2.2% | 1.7% | 1.9% | 1.7% | -0.2 ppt. |
| Wholesale & Retail Trade | 3.3% | 3.6% | 3.4% | 6.2% | +2.7 ppt. |
| Transportation & Utilities | 2.7% | 2.5% | 2.6% | 3.5% | +0.9 ppt. |
| Information | 1.5% | 2.0% | 1.7% | 3.0% | +1.2 ppt. |
| Financial Activities | 1.2% | 1.1% | 1.2% | 1.6% | +0.4 ppt. |
| Prof. & Business Services | 2.9% | 3.3% | 3.1% | 3.4% | +0.3 ppt. |
| Ed. & Health Services | 2.0% | 2.4% | 2.2% | 3.2% | +1.0 ppt. |
| Leisure & Hospitality | 6.4% | 6.3% | 6.4% | 9.2% | +2.8 ppt. |
| Other Services | 3.4% | 4.2% | 3.8% | 5.1% | +1.2 ppt. |
| Public Administration | 0.6% | 0.7% | 0.7% | 1.1% | +0.4 ppt. |
Figure 1 displays the data from Table 2 in a bar chart. In ten out of twelve industries, involuntary part-time employment is higher today than it was in either of the two comparable periods. In two industries (Construction and Manufacturing), it remains higher than one of the two previous periods. There is not a single industry in which involuntary part-time employment is lower today than it was from both of the other two periods.
FIGURE 1
Involuntary Part-Time Employment among Wage and Salary Workers, by Industry
Finally, Table 3 shows involuntary part-time employment as a share of total employment by occupation. Although it is down in the farming, fishing, and forestry occupations, it is up everywhere else. The largest increases have come in the services (+2.5 percentage points) and sales (+2.3 percentage points) occupations. There have also been relatively steep increases for the transportation & material moving occupations (up from 4.3 to 6.0 percent) and for the office & administrative support occupations (up from 2.1 to 3.6 percent).
TABLE 3
Involuntary Part-Time Employment as Share of Total Employment, by Occupation
| March 2001 to Feb. 2002 | Feb. 2005 to January 2006 | Average of Two Periods | June 2015 to May 2016 | Percentage-Point Increase | |
|---|---|---|---|---|---|
| Management, Business, and Financial Operations Occupations | 1.1% | 1.0% | 1.1% | 1.4% | +0.3 ppt. |
| Professional and Related Occupations | 1.5% | 1.9% | 1.7% | 2.4% | +0.7 ppt. |
| Service Occupations | 5.5% | 5.9% | 5.7% | 8.2% | +2.5 ppt. |
| Sales and Related Occupations | 3.2% | 3.6% | 3.4% | 5.7% | +2.3 ppt. |
| Office and Administrative Support Occupations | 1.9% | 2.3% | 2.1% | 3.6% | +1.5 ppt. |
| Construction and Extraction Occupations | 5.4% | 6.2% | 5.8% | 6.5% | +0.7 ppt. |
| Installation, Maintenance, and Repair Occupations | 1.8% | 2.0% | 1.9% | 2.4% | +0.5 ppt. |
| Farming, Fishing, and Forestry Occupations | 7.0% | 5.7% | 6.3% | 5.3% | -1.0 ppt. |
| Production Occupations | 3.5% | 2.9% | 3.2% | 3.2% | +0.0 ppt. |
| Transportation and Material Moving Occupations | 4.5% | 4.1% | 4.3% | 6.0% | +1.7 ppt. |
Involuntary part-time employment has increased significantly since before the recession. Moreover, this increase has been widespread across different ages, races, genders, industries, and occupations. Nonetheless, there has been some variation in terms of the degree of increases. For example, workers in the relatively well-paid management, business, and financial operations occupations have experienced just a 0.3 percentage-point increase in involuntary part-time employment. (In the financial industry specifically, it is up 0.4 percentage points.) When we look at demographic breakdowns, it becomes clear that involuntary part-time employment is up more for young workers than for prime-age or senior workers. Finally, when we break down the results by gender and race, we see that black women have experienced by far the largest increase in involuntary part-time employment as a result of the recession.

