

February 18, 2016
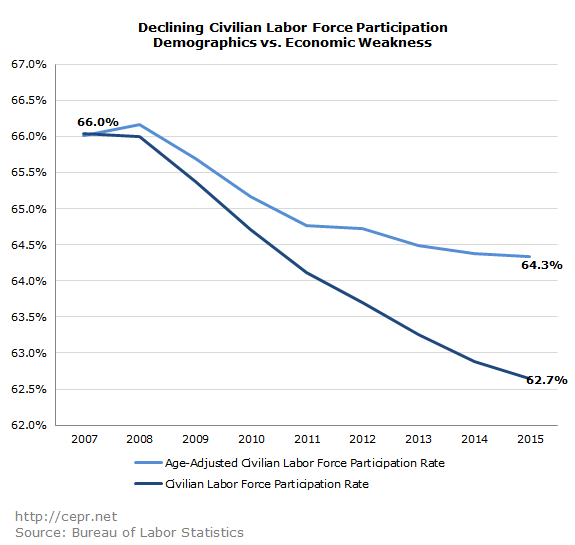
Between 2007 and 2015, there was a substantial decrease in the civilian labor force participation rate from 66 percent to 62.7 percent. Journalists and economists have debated how much of this decline can be attributed to a weak economy as opposed to an aging population.
The civilian labor force participation rate (LFPR) measures the percentage of the civilian non-institutional population (those who are 16 and above and not part of an institution, e.g. a mental institution, prison, etc.) who are in the labor force. The labor force consists of everyone who is either employed or unemployed (meaning they have searched for work sometime over the past four weeks). The LFPR may fall as a result of bad economy, as people give up looking for work due to a weak labor market, but it also changes due to demographics. If the population is aging, a greater percentage of the population may hit retirement age and willingly retire. Conversely, if the population is becoming younger, a greater percentage of the population may enroll in high school or college.
In order to assess the changes in the economy without age as a confounding factor, we have created an age-adjusted civilian labor force participation rate. This rate is based on the civilian labor force participation rate if there had been no changes in the age distribution since 2007.[i] While age has a significant effect on the overall civilian labor force participation rate, nearly half of the 3.4 percentage-point decline is due to changes in participation within age groups. This can be seen in the figure below.
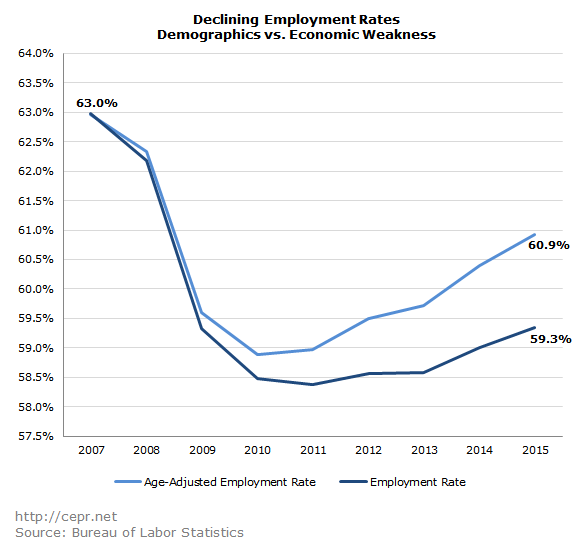
If the LFPR had been the same in each age group in 2015 as it was in 2007, nearly 4.3 million more Americans would’ve been in the labor force. However, because the LFPR does not differentiate between rates of employment and rates of unemployment, the change in the age-adjusted LFPR actually understates the decline in employment. Unemployment rates are still up within every age group, and the age-adjusted employment rate is down about 2 percentage points:
We have broken the decline in civilian labor force participation into four factors in the table below. The table shows how both demographics and economic weakness have affected the number of people employed and unemployed. Notably, the fact that 4.3 million people left the labor force actually understates the weakness of the economy because it doesn’t take into account the fact that unemployment was higher in 2015 than in 2007. Overall, close to 5.2 million people are out of work due to the weakness of the economy.
|
Change, 2007-2015 (Millions of people) |
Demographics |
Cyclical Weakness |
|
Unemployment |
-0.3 |
+0.9 |
|
Employment |
-4.0 |
-5.2 |
Given these estimates, if we consider that GDP per worker was around $120,000 in 2015, the loss of 5.2 million workers represents foregone output of $622 billion. However, due to an increase in involuntary part-time employment, even that is an understatement. If working hours returned to where they were in 2007, foregone output rises to $910 billion. There is a case to be made that these numbers are overstated given the nature of layoffs during the recession. Employers would not begin by firing their average-productivity workers, but rather their low-productivity workers; as such, we should expect that the foregone output of non-employed workers is less than $120,000 per year. However, even if we are overestimating the output gap by a factor of 1.5, foregone output still comes out to over $600 billion per year. This is a sign that we are operating well below capacity and that there are still major improvements to be made in today’s economy.
Between 2007 and 2015, the LFPR dropped 3.4 percentage points, equivalent to over 8 million people leaving the labor force. About half of this decline is attributable to the weakness of the economy rather than changes in demographics. Factoring in the rise in unemployment over this period, this translates into over 5 million fewer people with jobs as a result of the lingering effects of the downturn.
[i] We used breakdowns of employment and civilian labor force participation for the following age groups: 16-17, 18-19, 20-24, 25-29, 30-34, 35-39, 40-44, 45-49, 50-54, 55-59, 60-64, 65-69, 70-74, and 75+.

