

April 05, 2013

UCLA’s Roger Farmer has suggested that the government should bid up asset prices—say, purchasing shares of companies in the S&P 500 in order to drive up the stock market. In essence, he argues that the wealth effect will stimulate consumption and investment and lower unemployment.
But does the S&P 500 drive unemployment? And how much of an intervention would have been required to maintain full employment? Farmer kindly provided me the data behind his 2012 paper The stock market crash of 2008 caused the Great Recession: Theory and evidence. Using pre-1980 data to fit the model, I precisely reproduced his results. Figure 1 recreates Figure 6 of Farmer’s paper.
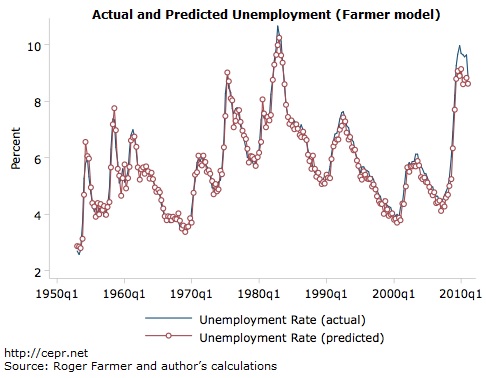
At first glance it appears that Farmer’s model fits post-1980 data pretty well, right up until the last few quarters. Yet Figure 2 shows the distribution of predicted and actual changes in unemployment. It shows that Farmer’s model is biased toward optimistic predictions of unemployment.
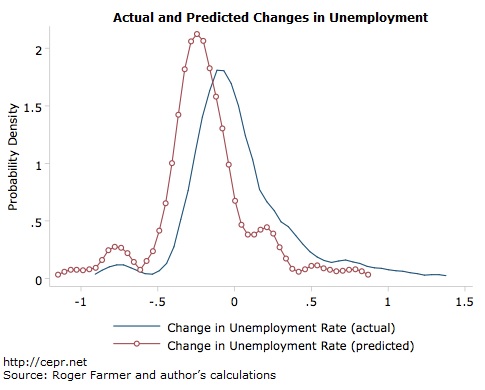
So why does Farmer’s model appear to hold up fairly well in Figure 1? It is largely because the model actually predicts changes in unemployment rates one quarter ahead but the unemployment rate does not change much from quarter to quarter. So when Farmer’s prediction is low in one quarter, the model yanks the prediction back up to its historical value before predicting the next quarter. In technical terms, Figure 1 looks good for Farmer because it takes advantage of serial correlation in the unemployment rate.
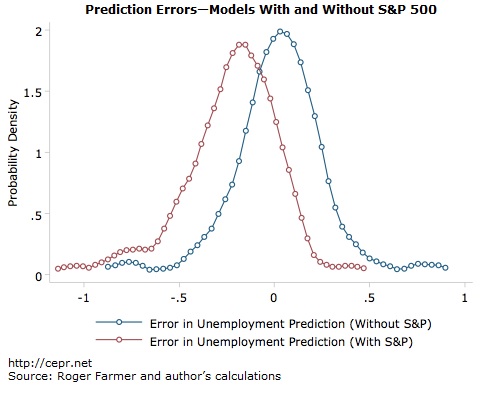
To see how easy it is to take advantage of serial correlation, we greatly simplify by removing the S&P 500 variable from the model. As it turns out, this greatly improves the out-of-sample predictions, as seen in Figure 3.[1]
Nevertheless, the fact that Farmer’s predictions are biased does not mean the S&P 500 doesn’t drive unemployment, and it doesn’t mean that the stock market crash in 2008 didn’t drive the Great Recession.
So what does Farmer’s model actually forecast? With no information about unemployment or the S&P 500 after the fourth quarter of 2007 (officially, the business cycle peak) Farmer’s model forecasts a significant fall in unemployment before settling in at 3.2 percent by 2010.
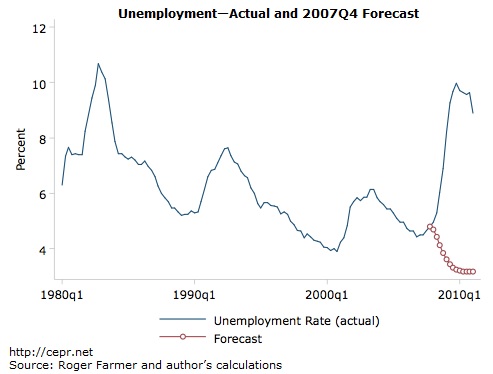
Had this forecast come to pass, it would have been the lowest rate of unemployment since 1953. However, Farmer argues that falling stock prices caused massive unemployment. Expected price movements– based on the last quarter’s price and unemployment– are already built into the model. Therefore, we ought to include unexpected price movements in the forecast. That is, using all actual data, we calculate the error in each quarter’s price prediction. This error represents an unexpected movement in the S&P 500—i.e., one unrelated to past prices or unemployment.
Even with perfect foresight regarding these unexpected movements in the S&P 500, the model forecasts unemployment to fall to 4.3 percent in late 2008 before climbing as high as 5.2 percent in the third quarter of 2009 and falling again. In short, as seen in Figure 5, Farmer’s model forecasts an extremely mild recession as a result of these unexpected movements in stock prices.
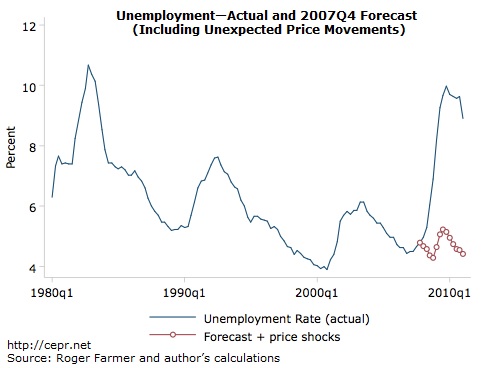
Thus, according to forecasts from Farmer’s model, the unexpected movements in the S&P 500 alone raised unemployment by less than 2 percentage points.
This approach of including unexpected price movements in the model forecasts a deeper fall in the S&P 500 than the one that actually occurred. If Farmer were correct, and the falling stock prices led to higher unemployment, then we would have expected to see an even deeper recession, not an extremely mild one.
Farmer’s model is telling us that the sudden rise in the unemployment rate was not caused by a sudden fall in stock prices. Nor does rising unemployment cause the fall in stock prices, resulting in an indirect increase in unemployment. Rather, the model indicates that an increase in the previous quarter’s unemployment rate causes stock prices to rise. The model therefore does not explain the Great Recession.
At the very best, if we believe the model and if we could have disrupted the fall in the stock market, and the prevention mechanism would not have disrupted the observed relationship between prices and unemployment, then unemployment would have grown more slowly. The question then becomes: if we could have foreseen the unexpected movements in unemployment, at what price would we require the S&P 500 to be?
In Figure 6 below, we see the S&P 500 at historical levels, and at the levels needed to maintain a 4.8 percent unemployment rate.
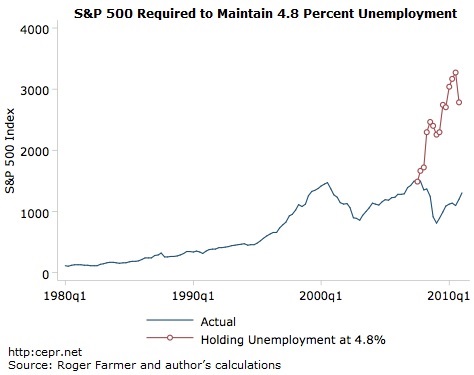
So under pretty heroic assumptions, it might have been possible to head off the recession by propping up the stock market. On the other hand, with a cyclically adjusted price-to-earnings ratio over 26, the market was already overvalued in the fourth quarter of 2007. Maintaining a 4.8% rate of unemployment would have required the S&P 500 to climb over 3250 by late 2010. This would imply a PE ratio of more than 59. By comparison, the 2000 stock bubble saw the PE ratio peak at 44.2.
In other words, even if Farmer is correct and his model is correct, then his policy solution would have been to create a stock bubble somewhere between the late-1990’s tech bubble and the prior decade’s Nikkei index bubble in Japan (peak PE of 78).
[1] The simplified model estimates the change in u based on last quarter’s change in u, where u is Farmer’s transformed unemployment rate. .

