

February 25, 2023

The January data on consumer expenditures released yesterday had many people freaking out. The story is that the Fed is going to have to get out the big guns to really shoot inflation down.
For those of us hoping that inflation would come down, without a big jump in unemployment, the report was definitely bad news. It showed strong growth in consumption, and more troubling, a 0.6 monthly increase in both the overall Personal Consumption Expenditure Deflator (PCE) and the core.
Many of us had expected a modest uptick from December’s 0.4 percent core, but the 0.2 percentage point jump was definitely disconcerting. So, the story in yesterday’s data was definitely bad news from the standpoint of moderating inflation, but we have to remember the fourteenth commandment, never make too much of a single month’s data.[1]
How Bad Is It?
First, on the demand side, the answer is pretty straightforward. As I noted when the January retail sales were released, the January jump was making up for declines reported in November and December. A 1.8 percent single month’s jump in consumption expenditures (1.1 percent real) sure looks like a big deal. But, if we take the increase over the last three months it is not much to get excited about.
The annual growth rate in nominal sales from October to January was 6.0 percent. If we take my preferred measure, comparing the last three months (November, December, and January) with the prior three months (August, September, and October), the nominal growth rate was just 4.2 percent. The corresponding growth rates in real consumption expenditures are 1.9 percent for October through January and 0.6 percent for the average of the last three months compared with the prior three months. It would be difficult to argue that these growth rates are unsustainable.
There is a question as to why we saw this quirky pattern, with very weak numbers in November and December, followed by an extraordinarily strong number in January. Part of the story is likely problems with seasonal adjustments. If people move their holiday purchases forward, say into October, then the seasonal adjustments would make November and December look weaker than they really are. This would also imply some automatic bounce back in the January data since the December sales had been understated.
It is also possible that January really was very strong, as we had better than normal weather in much of the country. That could have led people to do more shopping and buy more items than they would have if we had seen a typical January with snow storms and cold weather in the Midwest and Northeast. (That could also help explain the big jump in employment reported for the month.)
In either case, there is little basis in the January data for thinking that consumption is increasing at an unsustainable pace. If we see strong growth again in February, then we would have to reassess this view, but the January data taken in the context of prior months does not provide much reason for thinking that consumption is growing especially fast.
What About Prices?
If the reported surge in consumption can be easily dismissed, that is not true with the price data reported for January. Inflation looked to be clearly slowing through the fall, then we saw a 0.4 percent rise in the core rate in the PCE in December, followed by this 0.6 percent jump. That gave us a 4.7 percent annualized increase over the last three months and a slightly better 4.1 percent rate taking the average of the last three months compared with the prior three months. This is still down considerably from the peaks hit in the first half of 2022, but the downward trend is far less clear.
The reversal is partly due to new seasonal adjustment factors which now show higher inflation rates for the fall months than what had previously been reported. This makes inflation in recent months look worse, but does have the offsetting benefit that the seasonal adjustments will tend to lower inflation more in the months ahead. Still, if we are mistaken about the downward trend, seasonal adjustments will not give us one.
Comparing the 0.6 percent increase in the core in January with the relatively modest 0.2 percent rise in November, there are large differences in most components. For simplicity, we can divide the core into three main areas, rent, core goods, and services.
The Certain Decline in Rental Inflation
The story with rent is the simplest. The rent proper component rose 0.74 percent in January, down slightly from its 0.77 percent rise in November. Owners’ equivalent rent edged up very slightly from a 0.66 percent increase in November to a 0.67 percent increase in January. Clearly, this is not the story of the more rapid inflation in January.
This rate of rental inflation would be a cause for concern, but we know that it will soon turn sharply lower, based on the much lower rate of rental inflation shown in private indexes of marketed units. Later this year, we will likely be seeing rates of rental inflation that are comparable to or lower than their pre-pandemic pace.
Furthermore, pandemic supply chain problems slowed the construction of new units. There are now more units, especially in apartment buildings, under construction than when the Fed began raising rates last March. As these units get completed, it should put further downward pressure on rents.
For these reasons, we can be confident that rent will not be a major contributor to inflation later this year. That is a big deal since it accounts for most of the 40 percent of the core CPI and just under 17 percent of the core PCE deflator. If rent is not pushing inflation higher, and quite possibly pulling it lower, the picture will look considerably better in future months.
The Prospect for Price Declines in Non-Core Goods
The situation with services and core goods is more complex. Prices of the latter were pushed higher in 2021 and the first half of 2022 due to supply chain issues. This was the story of ships backed up at docks, unable to offload their cargo. There was also was a semi-conductor shortage due to a fire at a major factory in Japan, which led to a serious shortage of cars and trucks, sending their prices soaring.
Prices for many of these items had been falling in the summer and fall, but have stabilized or even edged higher in the last couple of months. This raises the question of whether prices have now adjusted to a new post-pandemic normal, or whether we should expect further price declines in the months ahead.
A way to gauge this is to compare pre-pandemic price trends, with where prices are today, adjusting for excess wage growth. I define the latter as the wage growth since the pandemic that exceeds the pace of wage growth for the prior five years.
The average hourly wage increased at a 5.1 percent annual rate in the three years from January 2020 to January 2023, compared to a pre-pandemic trend of 2.8 percent. As a result, wages were 6.9 percent higher last month, on average, than if they had continued at their pre-pandemic pace. The pre-pandemic trend for prices is defined as the rate of price growth in the five years prior to the pandemic.
The figure below shows current price levels for new and used vehicles, appliances, furniture, and vehicle parts. It compares the current price level, using the CPI, with the price level if the pre-pandemic trend had persisted, adding in 6.9 percent to account for the excess wage growth since the start of the pandemic.
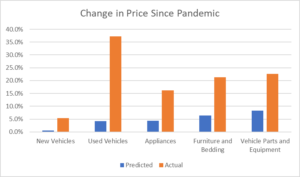
Source: Bureau of Labor Statistics and author’s calculations.
As can be seen, in all of these categories the actual price change has far exceeded the one predicted by extrapolating from trends and excess wage growth. (This pattern does not hold for all commodities. For apparel the actual price change since the pandemic was 5.4 percent, compared to the 5.1 percent increase that would be predicted by this formula.) For four of the five categories, the gap is more than 10 percentage points and in the case of used vehicles, it is more than 30 percentage points.
The predicted values are obviously based on a very crude calculation. However, when we are through all the pandemic and Ukraine war-related supply chain issues, we should expect to see the pattern for prices to return to something like their pre-pandemic trend path unless the pandemic permanently altered conditions of production or competition.
The large remaining gap between actual prices and predicted prices suggests that we should still expect substantial future declines in many areas where they were sharp rises in prices during the pandemic. The timing will vary depending on specific conditions in each industry. For example, auto manufacturers are still reporting that shortages of chips and other parts are impeding production. These shortages are much less severe now than last year, but it is not clear when production will be able to return to normal levels.
In other cases, production is likely to close to normal but it is a question of how long it takes for inventories to build up and then place downward pressure on prices. This has already happened in the case of televisions. After rising by 13.2 percent between August 2020 and August 2021, television prices have since fallen back by almost 20 percent and are now well below the pre-pandemic level. With the ratio of non-car inventories to sales now at or above pre-pandemic levels, we should expect further price declines in many commodities in the not-distant future.
Non-Rent Services
Federal Reserve Board Chair Jerome Powell has indicated that he is closely watching the trend in non-core services. These are areas like health care services, transportation services, and restaurants. The story here in the January data is clearly not good.
The price of health care services in the PCE rose 0.26 percent in January, after rising by 0.12 percent in December and just 0.07 percent in November. The price for transportation services rose by 1.05 percent in January, and the index for restaurants rose by 0.64 percent. There is a similar story with most other non-rent services.
However, there are two important reasons not to be too scared by these numbers. The first is that the price increases in services are at least partially driven by increases in goods prices. In the case of transportation, higher fuel prices are a big factor in airline prices. Also, the pandemic-related surge in the price of vehicle parts is a big factor in the price of car repair services. In the same vein, soaring food prices are a big factor in restaurant prices.
If these prices stabilize, and likely turn downward in many cases, the lower costs will be reflected in service prices. That doesn’t mean we may not see a problem of the excessive inflation in non-rent services, but we should recognize that at least part of the inflation we are seeing at present is due to increases in goods prices that will not continue.
The other, more important, issue is that inflation in services should ultimately be consistent with the pace of wage growth we are seeing. This simply means that we should not expect the capital share to either rise or fall indefinitely. And, since we saw a big shift from wages to profits in the pandemic, it would be reasonable to expect some period where the wage share increases at the expense of profits.
The rate of wage growth has fallen considerably over the course of 2022. The Employment Cost Index (ECI) rose at less than a 4.0 percent annual rate in the 4th quarter, down from a 5.8 percent rate in the first quarter. The annual rate of growth in the average hourly earnings (AHE) series for the three months that ended in January was 4.6 percent, down from a peak in this measure of 6.4 percent in January of 2022.
Monthly, and even quarterly data, are erratic, but it is clear that the direction of change is downward. In spite of the low unemployment rate and the high reported rate of job openings, wage growth has been slowing. There is no guarantee this slowing will continue, but there is no doubt about the direction of change over the last year.
The other point is that these rates of wage growth would suggest a slower pace of inflation in services going forward. While the pace of productivity growth is another big question mark, given past patterns, we should assume that inflation in services will be 1.0 to 1.5 percentage points less than the rate of wage growth. This would give us inflation in services of between 2.5 percent and 3.0 percent, based on the ECI, and 3.1 percent and 3.6 percent based on the AHE.
Are We Getting to the Fed’s Target?
Taking these stories together, we may still be looking at inflation somewhat above 2.0 percent through 2023, but it is likely that we will be getting close. If the rate of rental inflation falls to between 2.0-3.0 percent (slightly below the pre-pandemic pace), we see a period of falling non-core goods prices, and we have inflation in non-housing services of nearly 3.0 percent, we would be looking at an overall inflation rate of less than 3.0 percent. Whether we get close enough to 2.0 for the Fed to decide that it has done its job will depend on both the actual inflation rate and how the Fed interprets its 2.0 percent target.
I recognize that I have been consistently optimistic about the inflation picture since the early days of the pandemic recovery, so it is worth questioning my assumptions here. Perhaps the big pandemic price rises in goods will stick, implying a lasting shift to profits in this area. It is also possible that we will be in for a stretch of extraordinarily weak productivity growth in services, which would also mean more inflation. It could also be the case that wage growth will begin to accelerate again.
These are all real possibilities, which along with other factors could lead inflation to come in considerably higher than my calculations here. But, there is at least a plausible scenario that suggests that we will be close to the Fed’s inflation target by the end of 2023, without a big rise in unemployment.
It is indisputable that we have already seen a sharp slowing of inflation and wage growth even as unemployment has fallen to a fifty-year low. It is hard to see how we can rule out the possibility that this trend will continue.
[1] I am happy to say that the Wednesday release of 3rd quarter data from the Quarterly Census on Employment and Wages (QCEW), coupled with yesterday’s release from the Commerce Department, restored my confidence in the establishment survey. Noting the huge gap between job growth as reported in the establishment survey and employment growth in the household survey, I actually considered the possibility that the household survey was closer to the mark. However, the 3rd quarter QCEW hugely outpaced the reported job growth in the establishment survey for the quarter, putting the combined 2nd and 3rd quarter numbers for the two series within spitting distance of each other. The receipts on social insurance taxes reported in yesterday’s release, which come from the Treasury Department, fit closely with the big jump in employment reported in the establishment survey for January. With these important independent data sources looking pretty close to the establishment data, we can be comfortable that it is giving us a reasonably good picture of the labor market.


Comments