

July 21, 2020


As noted in a previous CEPR article, the employment-to-population ratio, or EPOP, for 16 to 24-year-olds fell at twice the rate of the decline in overall employment between February and April 2020. In this article, we document trends in young people’s employment and month-to-month labor market transitions through June 2020. While there has been some recovery in young people’s employment since April, young workers continue to be disproportionately impacted since the beginning of the pandemic.
Over 1.5 million fewer young people had jobs in June 2020 compared to March 2020
Table 1 tracks employment by age from March through June in both 2019 and 2020. The declines in employment between March 2020 and June 2020 show people ages 20 to 24 experienced the largest declines (7.5 percentage points compared to 6.2 percentage points for 25 to 54-year-olds).
| 2019 | 2020 | June 2020-June 2019 (p.p. change) |
|||||||||
| March (%) |
April (%) |
May (%) |
June (%) |
June-March (p.p. change) |
March (%) |
April (%) |
May (%) |
June (%) |
June-March (p.p. change) |
||
| 16-19 | 29.3 | 28.0 | 29.3 | 35.6 | 6.3 | 29.0 | 19.1 | 22.7 | 29.5 | 0.5 | -6.1 |
| 20-24 | 66.1 | 67.0 | 67.8 | 69.8 | 3.7 | 63.3 | 47.6 | 50.6 | 55.8 | -7.5 | -14.0 |
| 25-54 | 79.8 | 79.9 | 79.9 | 79.5 | -0.3 | 79.5 | 69.8 | 71.5 | 73.3 | -6.2 | -6.2 |
| 55+ | 39.0 | 39.1 | 39.1 | 38.7 | -0.3 | 38.4 | 33.5 | 34.2 | 35.0 | -3.4 | -3.7 |
Source: Authors’ analysis using data from Bureau of Labor Statistics, series LNU02300012, LNU02300036, LNU02300060, LNU02300012; Not Seasonally Adjusted
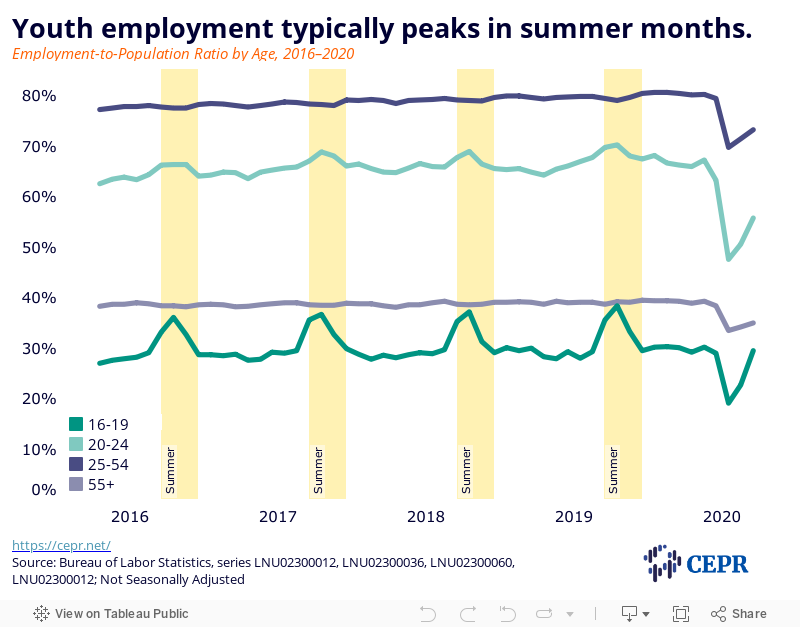
Among the youngest workers (16 to 19-year-olds), employment is typically flat and relatively low during the school year, then rises by about 5 to 7 percentage points during the summer. (See Figure 1 for these trends since 2016). In 2020, however, 16 to 19-year-olds experienced a sharp drop in employment between March and April (nearly 10 percentage points, or about one-in-three workers in this age range). It took two more months (April to June) to return to their March employment level. Looking at 16 to 24-year-olds as a whole, there were 1.4 million fewer young people employed in June 2020 than in March 2020.
Over 4 million fewer young people had jobs in June 2020 compared to June 2019
Looking at differences in employment between June 2019 and June 2020, 20 to 24-year-olds experienced declines that were much larger than any other age group (14 percentage points compared to 6.2 percentage points for 25 to 54-year-olds). In numerical terms, 4.1 million fewer young people (16 to 24-year-olds) were employed in June 2020 than in June 2019. This includes 1.1 million fewer employed 16 to 19-year-olds and 3 million fewer employed 20 to 24-year-olds. As Figure 1 shows, youth employment typically peaks in July, but given the surge in COVID cases and the reimposition of shutdown orders in various states, it is possible that youth employment could flatline or even decline between June 2020 and July 2020. (According to at least one experimental indicator, the Census Bureau’s Household Plus Survey, youth employment appears to have declined mid-June 2020 and early July 2020).
Young People Were More Likely to Experience Negative Labor Market Transitions Since March 2020
Figures 2 through 4 use the longitudinal design of the Current Population Survey (CPS) (see Methodology section below) to track month-to-month employment transitions for individuals in the first half of 2020. Specifically, this report tracks transitions of the same individuals: 1) from employment in one month to unemployment in the following month (from working to not working, but looking), or E→U; and, 2) from participating in the labor force to not in the labor force in the following month (from having a job or looking for one, to not working and not looking), or LF→NILF.
Figure 2 shows young people who worked in March, April, or May 2020 were much more likely to transition from employment to unemployment in the following month than people in other age groups. For example, nearly one-quarter (22.9 percent) of 16 to 19-year-olds and just under one-fifth (18.3 percent) of 20 to 24-year-olds employed in March were unemployed in April. By comparison, about one-tenth of 30 to 54-year-old workers and workers age 55 and over moved from employment to unemployment between March and April 2020. In subsequent months (March to April, April to May, and May to June), these age disparities narrowed, but young people were still more likely to transition from employment to unemployment.
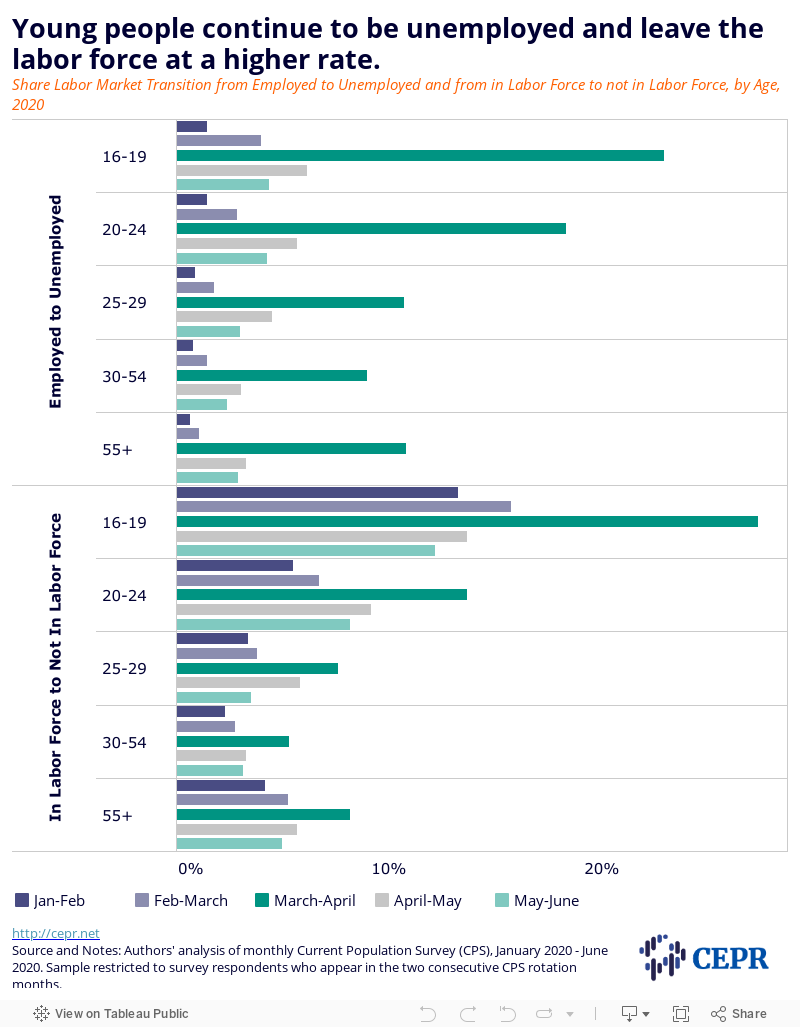
Young people who were in the labor force in March, April, or May 2020 were also much more likely to transition from being in the labor force to not in the labor force in the following month. Among 16 to 19-year-olds who participated in the labor force (whether employed or unemployed) in March, more than one-quarter (27.3 percent) left the labor force in April. This compares to about 5 percent of 30 to 54-year-olds who made the same transition.
Between a normal May and June, we would expect to see relatively few young people leave the labor force, and more to move from unemployment or not being in the labor force to employment. However, between May and June 2020, about 12 percent of 16 to 19-year-olds left the labor force, and about 4 percent of employed 16 to 19-year-olds were no longer working but remained in the labor force.
Labor Market Transitions by Gender, Race, and Ethnicity
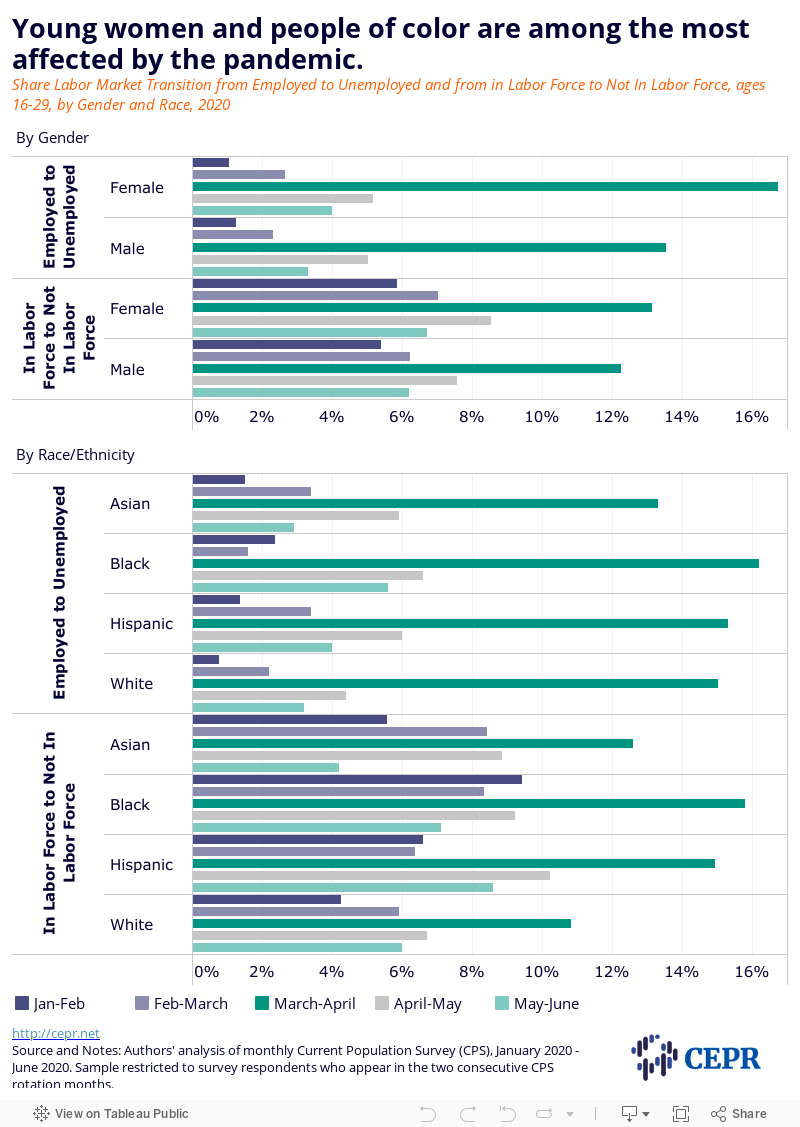
Figure 3 shows month-to-month employment transitions in the first half of 2020 for 16 to 29-year-olds by gender and race/ethnicity. (We look at this wider age range to increase the sample size and the reliability of the estimates, particularly for Asians, Blacks, and Hispanics).
As this figure shows, young women are generally more likely than young men to move from employment to unemployment, and from being in the labor force to not in the labor force. Between March and April, about 17 percent of employed young women transitioned from employment to unemployment, and about 13 percent of young women in the labor force transitioned out of it. Among young men, the shares were just under 14 percent, and slightly over 12 percent, respectively. The job loss gender gap narrowed somewhat in subsequent months.
Black and Hispanic 16 to 29-year-olds are generally more likely than white people in the same age range to move from employment to unemployment, and from being in the labor force to out of it. Between March and April, young Black workers were somewhat more likely to transition from employment to unemployment than white, Hispanic, and Asian workers. Specifically, 16.2 percent of young Black workers became unemployed compared to about 15 percent of white, and Hispanic workers, and 13.3 percent of young Asian workers. In subsequent months, however, young Black, Hispanic and Asian workers were all more likely to move from employment to unemployment than young white workers. The trends in movement from being in the labor force to out of it are similar.
Labor Transitions by Occupation
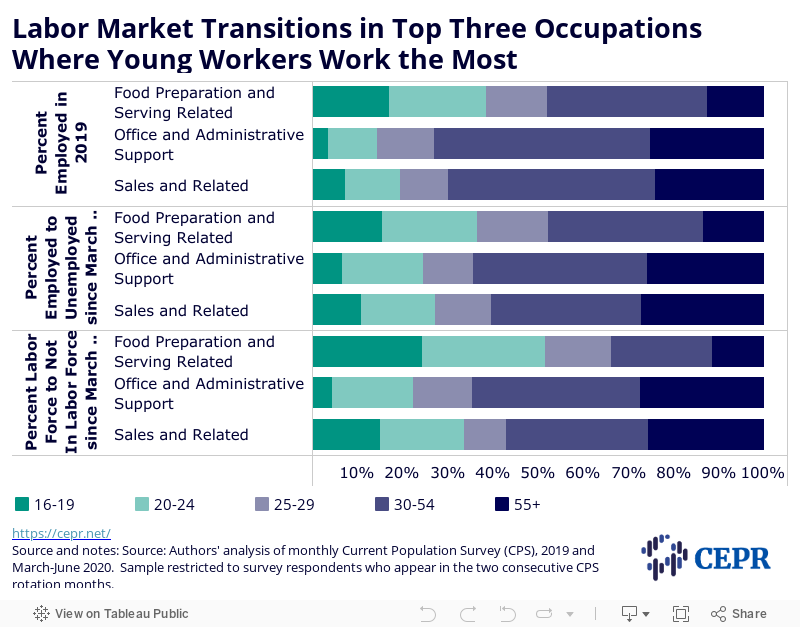
In Figure 4, we track the share of individuals going through the same two labor market transitions by occupation. In this figure, we focus on the three major occupational categories that employ the largest number of young workers: Food Preparation and Serving Related (35-0000), Sales and Related (41-0000), and Office and Administrative Support (43-0000). In 2019, more than half of 16 to 24-year-olds (55.6 percent) were employed in these three occupational categories.
The top panel of Figure 4 shows the age distribution of all workers in each of these three occupations in 2019. The middle panel reveals the age distribution of all workers in each occupation who moved from employment to unemployment in two consecutive months since March 2020. The bottom panel shows the same for people moving from being in the labor force to out of it.
As the figure suggests, more than one-half of Food Preparation and Serving Related workers were under age 30 in 2019. Among all workers in these same occupations who moved from employment to unemployment since March 2020, about the same share are under age 30. However, young people in these occupations account for a much larger share (about 66 percent) of all people in these occupations who moved from being in the labor force to out of it over the same time period. In the other two occupations (Sales and Related, and Office and Administrative Support), young people are overrepresented (relative to their employment shares) among all workers in these occupations moving from employment to unemployment, and from being in the labor market to being out of it.
Conclusion
Declines in employment have disproportionately impacted young people since the beginning of the pandemic. It seems increasingly unlikely that their employment opportunities will improve much, if at all, this summer. Given the recent rise in COVID cases, young people are safer not working, unless they can work from home, which is available to relatively few of them. However, not working means lost income, not just for young people themselves, but also for parents and other family members who depend on them to contribute to household expenses. According to recent estimates by sociologist Philip Cohen nearly half of all 18 to 29-year-olds — 25.4 million young adults — were living at home with parents or grandparents in June 2020, an increase of 3.1 million from what would be expected based on pre-pandemic trends.
Before the end of July, Congress should extend the extra $600 per week in Unemployment Insurance (UI) benefits, and take other steps to help young people and their family members weather the ongoing storm. Other steps should include retroactively extending the CARES Act Economic Impact Payment to 17-year-olds and young adults claimed by their parents as dependents (and including them in any future payments), providing substantial additional fiscal support to state and local governments, providing hazard pay to poorly compensated frontline workers, and student loan forgiveness. Beyond these immediate steps, much more needs to be done to address economic security and inequality among young people that preexisted the pandemic. This includes establishing a minimum-income system that provides a money-income floor to low-income people, including young adults, who aren’t eligible for benefits that are tied directly to past or current employment, and improving access to the Supplemental Nutrition Assistance Program (SNAP) for young adults, including students.
Methodology
This report uses the longitudinal design of the basic monthly Current Population Survey (CPS) accessed through IPUMS-CPS. The CPS respondents are interviewed for four consecutive months, ignored for eight months, and interviewed for another four consecutive months. We construct our sample by following individuals who appear in two consecutive months and dropping those who miss a survey month. We automatically drop individuals in their fourth or eighth month-in-sample (e.g., we cannot track individuals in their fourth month-in-sample because they leave the sample the following month). This structure allows us to 1) compare the same individuals who go through a labor market transition from month one to month 2; and, 2) overcome sample size limitations of the monthly CPS. We create the individual linkage using the IPUMS variable that identifies unique individuals across adjacent CPS months (“CPSIDP”) and use their longitudinal weights for two adjacent months (“LNKFW1MWT”).

