

November 24, 2022

The media’s coverage of the economy in the last year and a half has inflation playing a starring, and almost exclusive, role. Items like the 50-year low in unemployment reached earlier this year have barely been mentioned.
Inflation has clearly been uncomfortably high, with the rising price of necessities putting a major burden on many households. But the story of mass impoverishment told by the media simply does not fit the data.
Wages for workers at the bottom have largely kept pace with inflation, with workers in low-paying industries, like hotels and restaurants, actually seeing pay gains that outpace inflation. We have also seen twenty million families refinance their mortgages, saving thousands of dollars a year in interest payments. And, the number of people working from home has increased by close to ten million. These workers are saving thousands a year in commuting costs.
For this reason, the idea that large segments of the country are experiencing extraordinary hardship does not make sense. This comes with the usual qualification that around 20 percent of the country (roughly 70 million people) are always struggling to get by, even in good times. However, the idea that times are much worse than in pre-pandemic years, for most of the population, is simply not true.
One way to get a sense of how people are doing is to look at how much they are consuming. We have quarterly data from the Commerce Department that allows us to measure real consumption. This is of course aggregate, so it is not measuring the distribution of consumption, but with the real wage gains at the bottom and the money saved on refinancing for millions in the middle, we can be reasonably comfortable that it is not all going to the top.
The figure below shows aggregate consumption, with one important modification. It pulls out consumption of health care services.[1] We have actually seen the share of spending on health care fall sharply since the pandemic. With people spending less on healthcare, it means that they have more to spend on other items.
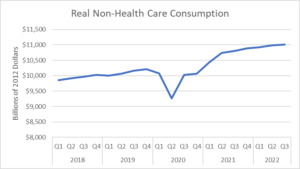
Source: Bureau of Economic Analysis and author’s calculations.
As can be seen, spending on non-health care items has grown rapidly over the last three years. Real non-health consumption is up 7.8 percent since the fourth quarter of 2019, which translates into an annual growth rate of just under 2.8 percent.
For the curious, the biggest increase has been in consumption of durable goods, which were 25.6 percent higher in the third quarter of 2022 than in the fourth quarter of 2019. While most categories of durable goods had substantial increases, the largest increase was a 53.0 percent rise in spending on recreational goods, items like televisions and sporting goods. That doesn’t seem to fit the story of mass suffering told in the media, but who are you going to believe, CNN or government data?
It is worth asking about the drop in health care spending. People are relying more on telemedicine and home diagnostics. It is too early to know whether this corresponds to a decline in the quality of care. But it is important to remember that what we care about is health, not the number of doctors visits or medical tests. If we can get by with spending less on services, without jeopardizing the quality of care, this is a big plus. We will have to see if that is the case.
[1] These data are taken from National Income and Products Account Table 2.4.6U. The calculation takes total consumption (Line 1) and subtracts spending on therapeutic appliances and equipment (Line 64), pharmaceutical and other medical products (Line 119), health care services (Line 170), net health insurance (Line 273).


Comments