

December 13, 2012

Casey Mulligan digs himself in deeper with a follow-up post on his argument that: 1) the expansion of social insurance programs in response to the recession was a big problem because it “erased” unemployed American’s incentives to work; and 2) the best evidence of this is that the individual poverty rate, when measured using one of several experimental poverty measures, rather than the official measure, did not rise between 2007 and 2011.
There are just a few teensy problems with his argument. I’ll focus here on his assumption that poverty did not rise. The chart below tracks the poverty, using the official and two experimental measures, from 2005 to 2011 for people 18-64. I focus on working-age adults because they are the group that seems most relevant when it comes to incentives to work.
The chart shows that poverty really did increase between 2007 and 2011 for working-age adults. The darker olive green line (second from top) is the poverty rate using the experimental measure Mulligan points to in support of his argument—as you can see, it’s higher in 2011 than in 2007.
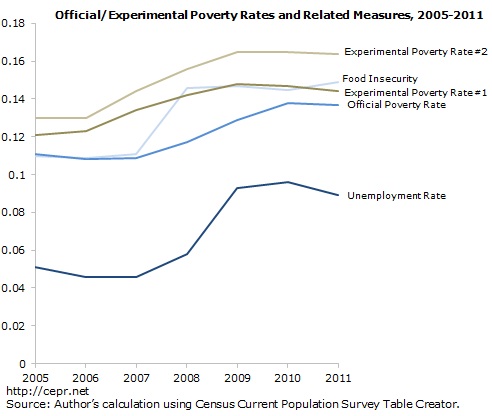
Similarly, the top-most green line uses another experimental poverty measure, one that includes what I think is a slightly better treatment of health care needs. This measure also shows an increase in poverty.
So, if work incentives are what you care about and you like these experimental measures, poverty, for the relevant age group, increased between 2005-2011.
Moreover, there’s good reason to believe that the experimental poverty measures understate the increase in poverty between 2007-2011 among working-age adults, and overstate the increase in poverty in the years before the Great Recession. You can see this in the rather puzzling jump in the experimental poverty lines between 2006 and 2007, even though there was no increase in unemployment or the official poverty rate.
Part of the reason for this jump is that the experimental thresholds rose at a faster rate (38%) than the official thresholds (24%) between 1999 and 2007, and then at a slower rate between 2007 and 2011 (5% vs. 8%). See my brief technical note below on why this happened; the most important thing to know is that some of the kinks in the experimental thresholds remain to be worked out and should be used with caution. Especially when making big claims about “the microeconomics of poverty since 2007.”
Finally, if by poverty we mean something like people not meeting a basic standard of material well being and economic security, it’s worth noting that: 1) food insecurity increased from 11.1 percent in 2007 to 14.9 percent in 2011 and very low food security from 4.1 percent to 5.7 percent; 2) the percentage of working-age adults without health insurance increased between 2007 and 2011; and 3) family net worth declined substantially for all income groups, including the bottom two income quintiles, between 2007 and 2010 (for the bottom quintile, which didn’t have much to start with, net worth fell by 27 percent, and, for the second quintile by 35 percent).
Social insurance and the Obama Stimulus, limited as it was, have and continue to play a fundamentally important role in limiting the damage. But even taking that into account, real poverty really did rise during the recent recession.
Brief technical note on increase in certain experimental measures of poverty between 2006-2007: The experimental poverty thresholds are tied to a percentage of median consumption expenditures on food, clothing, shelter, and utilities (FCSU). The official poverty threshold is tied to inflation. In the years before the recession, median consumption on these goods (FCSU) increased at a faster rate than inflation, so the experimental thresholds increased at a faster rate than the official ones. More generally, overall consumption hit a record high relative to disposable income in 2004-2007. There may be a conceptual case for having poverty thresholds that increase at a faster rate than median income in such a short period, but I’m not aware of what it is. Also, some analysts believe that changes in the wording of survey questions related to food in the Consumption Expenditure Survey played a role in the 2006-2007 jump.

