

December 08, 2022
The authors thank Dan Beeton, Michael Galant, Debarati Ghosh, Brett Heinz, Alex Main, Mark Weisbrot, and Aileen Wu for helpful comments, suggestions, and editorial work. The authors also thank the participants at the International Monetary Fund Civil Society Meetings on October 13, 2022, where a previous version of this work was presented, for their valuable feedback.
The formula used to determine a country’s voting power at the International Monetary Fund (IMF) rewards economic size, trade openness, and the accumulation of reserves, but ignores countries’ contributions to the climate emergency. The largest global cumulative emitters of carbon dioxide (CO2) are also the most powerful countries at the IMF in terms of their voting shares. To give more decision-making powers to the countries most impacted by climate change and incentivize all countries to cut emissions, we propose a necessary update to the IMF’s voting formula by adding a variable representing member states’ shares of cumulative CO2 emissions since 1944.
The inclusion of our climate variable would significantly reduce the voting shares of the greatest CO2 emitters, and increase those of lower emitters, located primarily in the Global South1. If we assume countries fully adopt our formula proposal (i.e., with no subsequent opaque negotiations), the major winners would be Small Island Developing States (SIDS), which are among the countries most vulnerable to climate change, especially to rising sea levels. The vote share of these countries would increase from approximately 2.5 percent to nearly 21 percent, thereby significantly increasing their decision-making power within the Fund. The US vote share would decrease from 16.5 to 5.64 percent, and China’s share would drop from 6.1 to 5.36 percent. Along regional lines, the Global South countries’ vote share would increase from 37.0 to 56.4 percent, and, significantly, sub-Saharan African countries’ share would expand from 4.9 to 9.0 percent. Advanced economies would see 12 percent of their votes transferred to emerging and developing economies.
“The Articles of Agreement of the WTO and the IMF should abide by COP resolutions and not the other way around” –Colombian president Gustavo Petro at COP 27, Egypt, November 7, 2022. 2
Created in the wake of World War II as a Bretton Woods institution tasked with stabilizing fixed exchange rates, the International Monetary Fund (IMF) has evolved into its current role in economic crisis management and is a critical actor within the international monetary and financial system. Although technically accountable to and representative of 190 countries, the organization’s decision-making power is concentrated in the hands of so-called advanced economies. Crucially, the United States’ voting share, based on its IMF quota, gives it veto power over the most critical decisions, including the decision to redistribute voting power.
The quota formula, which rewards gross domestic product size, trade openness (including the level of exports and imports), and the accumulation of reserves by central banks, has a critical blindspot — it ignores a country’s impact on global climate. In the context of rising global inequality and an escalating climate emergency, this is a glaring omission. Though the IMF’s Articles of Agreement have a narrow economic mandate, the prevailing forms of national economic development have a direct impact on greenhouse gases in the atmosphere, and climate change poses a macro-critical risk to the global economy.
We propose a necessary update to the IMF’s quota formula, and thus to the distribution of voting power, by including member states’ shares of cumulative carbon dioxide (CO2) emissions since 1944.
Global climate considerations were not a priority when country representatives met in 1944 in Bretton Woods, New Hampshire, to discuss a new system of international economic and financial cooperation. At that time, economic growth was synonymous with postwar reconstruction and development. Dozens of now independent countries were then still colonies of Western European nations. Because it had not been bombed, and because its economy and industry had grown at a record pace during the war, the US had vastly increased its manufacturing output to an astounding 50 percent of global production.3 When the Bretton Woods Institutions were founded, power was centered in the North Atlantic and the governance of the institutions, therefore, hinged on a “gentleman’s agreement” that guaranteed that a US citizen would preside over the World Bank and that a European would preside over the IMF.4 Climate was not on the agenda in 1944, and was not considered to be either an economic issue or a governance issue.
Environmental sustainability and the threat of climate change first came to the fore as a matter that required international state cooperation at the 1992 United Nations Conference on Environment and Development in Rio de Janeiro, Brazil, known as the Rio Earth Summit. In the 30 years since, global cumulative CO2 emissions have increased by more than 50 percent5 and environmental degradation and loss of biodiversity have sharply accelerated. 6 Principle 7 of the 1992 Rio Earth Declaration had already identified the importance of countries’ shared commitment, and varying degrees of responsibility, stating:
The States have common but differentiated responsibilities. The developed countries acknowledge the responsibility that they bear in the international pursuit of sustainable development in view of the pressures their societies place on the global environment and the technologies and the financial resources they command.7
However, three decades later, Intergovernmental Panel on Climate Change (IPCC) negotiations have revealed that the impasses that prevent international climate goals from moving forward are largely the same stumbling blocks that emerged at the 1992 Earth Summit. 8 In the 27th United Nations Climate Change Conference (COP27) in November 2022 in Egypt, developing countries were still aiming to limit temperature increases. In a statement on behalf of Like-Minded Developing Countries (LMDCs)9 during COP27, Bolivia expressed, “much of the impacts we are facing today are the effects mainly due to the historical and cumulative emissions of developed countries, who have till today, not rapidly reduced their emissions despite all their promises to do so, and not provided any significant support to developing countries, failing in reaching their commitments under the Convention,” and further, “The backdrop of the climate crisis is one of deepening climate injustice, since developed countries are attempting systematically to shift the burden to address climate change on to the developing countries and now to the private sector.”10 LMDCs reiterated this analysis in a post-COP statement. 11
In general, developing countries bear the least responsibility for the climate crisis, yet face the greatest burdens in terms of its impacts. Small Island Developing States (SIDS) are among the most vulnerable 12of these.13 They are the first to be affected by rising sea levels and extreme weather events and are deeply impacted by the structural challenges associated with climate change. Despite their negligible role in creating the climate crisis, these countries have little to no say in shaping the economic policies that will determine the global response to the challenges ahead; SIDS together account for approximately 1.5 percent of the IMF quota, and 2.5 percent of votes. 14
Meanwhile, it is the countries whose carbon emissions exceed their “fair share” based on population that have the greatest say in how the Bretton Woods institutions are currently governed. 15 Therefore, they have the greatest cumulative power in dictating what sort of support these institutions will provide to those countries most at risk from climate change impacts, including the economic repercussions. In proposing an empirical framework for measuring a country’s responsibility for climate damages, economic anthropologist Jason Hickel finds that if each country’s contribution to climate change is calculated based on its cumulative carbon emissions, its “fair share” of emissions by population, and its historical record of emissions, 92 percent of countries that “overshoot” their fair share are from the Global North. 16
To respond to the enormity of this crisis — to both mitigate its harms and adapt to its disruptions — the IMF estimates global climate financing needs to be in the range of $3–4 trillion annually. 17 Adaptation needs alone are estimated to amount to as much as $300 billion per year by 2030. 18 Yet current provisions for climate financing are vastly insufficient.
In 2009, rich countries pledged to provide $100 billion per year in climate financing by 2020 (i.e., just a third of the estimated financing needs for climate adaptation only), but even this insufficient commitment has not been met. 19 Additionally, climate-related financing made available through the IMF’s recently created Resilience and Sustainability Trust will come in the form of debt that must be repaid, with potentially costly and harmful conditions attached. 20 At COP27, advanced economies signaled willingness to establish a fund for “loss and damage,” a core demand of G77 countries at the summit; 21 details are supposed to be finalized during COP28.
During 2021’s COP26 Summit in Glasgow, Scotland, the prime minister of Barbados (a Caribbean SIDS), Mia Mottley, put forward a proposal for addressing the historic gap in climate finance: a yearly issuance of IMF Special Drawing Rights (SDRs). Since Mottley popularized this proposal, government officials, lawmakers, and civil society organizations have begun to consider how SDRs could change the landscape of “available” resources to combat climate change. 22 Periodic SDR issuances would provide significant, immediate financial support to countries struggling to respond to climate change. 23 Funding would become available to carry out green transitions, such as through infrastructure or investment projects, and to respond to urgent climate-driven shocks. 24 However, the distribution of current voting power at the IMF means that the decision to issue more SDRs is effectively determined by the largest emitters — the US and other advanced economies — and not by the countries that would actually use and benefit from SDRs to address climate change. As of the publication of this paper, the US and other advanced economies have signaled that they do not support a new SDR allocation, despite repeated calls for an allocation by African governments and hundreds of international civil society organizations. 25
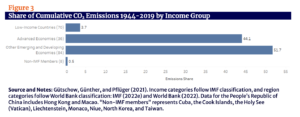
Figure 2 shows the top 20 countries with the largest cumulative CO2 emissions. In assessing a nation’s contribution to the climate crisis, it is cumulative emissions that matter, since carbon dioxide remains in the atmosphere between 300 and 1,000 years, while most other gases are relatively ephemeral. 26 Figure 3 shows historical emissions since the inauguration of the IMF and other Bretton Woods institutions and demonstrates that the primary responsibility for cumulative CO2 emissions rests with high-income countries.
Figure 2
Share of Cumulative CO2 Emissions 1944–2019 by Country (Top 20 Countries)
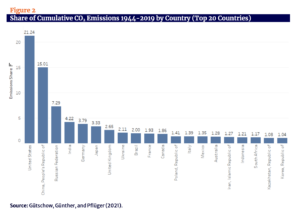
Figure 3
Share of Cumulative CO2 Emissions 1944–2019 by Income Group
The largest global cumulative emitters are also the most powerful member countries at the IMF. The top 20 emitters hold 64 percent of IMF voting power (Figure 4).
Figure 4
Voting Power of Largest Emitters 1944–2019 vs. the Rest of IMF Members
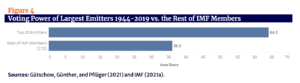
Source: Gütschow, Günther, and Pflüger (2021).
Note: Income categories follow IMF classification, and region categories follow World Bank classification. 27
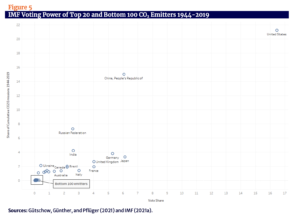
The largest global cumulative emitters are also the most powerful member countries at the IMF. The top 20 emitters hold 64 percent of IMF voting power (Figure 4).
Figure 5
IMF Voting Power of Top 20 and Bottom 100 CO2 Emitters 1944–2019
Our proposal focuses on the formula for distributing quota shares at the IMF. We present a brief overview of how the distribution of IMF quota shares is linked to that of voting power and therefore to the structure of IMF governance itself.
At the IMF, most major decisions are determined by two main bodies. The first is the IMF’s Executive Board, a group of 24 permanent “executive directors” each representing one country, or a group of countries. This group conducts most of the IMF’s day-to-day operations and is chaired by the managing director. The Executive Board’s power, however, is delegated by the IMF’s highest decision-making body, the Board of Governors, which consists of one governor and one alternate governor from each of the IMF’s 190 countries. In this body, country representatives are typically ministers of finance or central bank governors — not ministers of the environment. Most importantly, any change to the IMF’s governance structure has to be approved with a 85 percent majority at the Board of Governors. 28 Important decisions related to IMF finances, such as loan exchange rates, and the valuation of SDRs, require 70 percent of the vote. 29 Most other decisions at the Fund can be made with a simple vote majority, but in practice, voting rarely takes place as the managing director is expected to “read the room” instead. 30
A country’s quota share is a key first step in determining a country’s final voting share at the IMF governing bodies. Each member country’s quota share also determines its maximum financial commitment to the IMF, its access to funding, and its SDR allocation in the event of an issuance. 31
A key limitation of the quota system is its reinforcement of “structures in which the United States exercises its leadership position,” according to the US Treasury. Given that the US has over 16 percent of voting shares, it has effective veto power over major decisions at the Fund. The 2010 reforms to the Fund’s Articles of Agreement — not ratified until 2016 — once again ensured that, as the US Treasury argued, “the U.S. would remain the IMF’s largest shareholder and the only country in the world with veto authority over major decisions at the IMF.” 32 In practice, the US’s decision-making power at the IMF has been much greater than as determined by its voting share: the high-income countries have almost always reached agreement among themselves, and when there have been differences (e.g., between the US and Europe, which has a larger cumulative voting share than the US) a consensus has generally been reached that accepts the US position. 33
As explained in the figure below, distribution of voting power begins with a “calculated quota share” (CQS) determined by the IMF’s formula, which incorporates particular economic variables from each country. 34 However, the “actual quota share” (AQS) is determined by complex negotiations between member states during a General Review of Quotas. 35 Shares are then converted to an absolute number and added to a basic number of votes per country (set at 5.502 percent of total votes), which translates into that country’s number of votes at IMF governing bodies.
Figure 6
Quota and Voting Shares
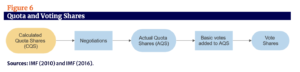
Negotiations at the stage between CQS and AQS are not transparent.36 For example, negotiations in the Fourteenth General Review of Quotas 37, resulted in an increase in the US’s quota share from 16.99 to 17.40 percent and a dilution of China’s quota share from 7.92 to 6.39 percent. 38
Changes to the initial quota formula-determined distribution of votes face several checks within the IMF governance system. As mentioned above, any changes in the distributed actual quota share requires an 85 percent majority, and a country’s quota cannot be changed without the country’s consent. Countries may request an ad hoc quota adjustment outside of general reviews of the quota, which occur every five years. While there have been sustained efforts to alter the formula and quota shares, such calls for reform have been pushed aside. 39 Nor have these reform proposals taken into account the challenges of addressing climate change. With the climate crisis now a first-order priority at the global level, a fresh revisitation of the IMF quota system for determining vote shares is in order.
We use data through 2019 published by the IMF following the 14th quota reform, and updated in 2021. 40 The IMF quota formula contains the following variables and weights:
Quota = (0.50*GDP + 0.30*Openness + 0.15*Variability + 0.05*Reserves)^K.
The variables are defined as follows:
GDP = 60% market GDP and 40% PPP GDP; average over three years
Openness = annual average of the sum of current payments and current receipts (goods, services, income, and transfers) over a five-year period
Variability = variability of current receipts and net capital flows (standard deviation from the centered average over three years, over a period of 13 years)
Reserves = official gold and currency reserves (monthly average over a recent year)
K = compression factor equal to 0.95
To note: each of the variables faces methodological questions around official sources, periods of relevancy, conversion factors, and time lags. We will not delve into these issues or into what these variables would look like today.
To calculate votes, the IMF assigns one vote per 100,000 SDRs according to each country’s quota. Then, a number of basic votes, calculated as 5.502 percent of total votes, is added equally to each country’s existing number. 41
Figure 7
Voting Power at the IMF
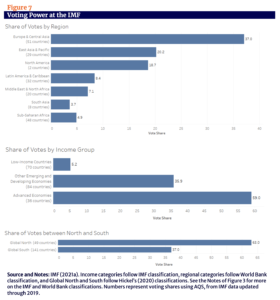
Note: Income categories follow IMF classification, regional categories follow World Bank classification, 42 and Global North and South follow Hickel’s (2020) classifications. Numbers represent voting shares using AQS, from IMF data updated through 2019. Source: IMF (2021a).
For our climate variable, we use cumulative CO2 emissions over time. It is the most appropriate scientific measurement of national responsibility regarding climate change, as carbon dioxide remains in the atmosphere between 300 and 1,000 years. Although yearly CO2 emissions data from 1990 is readily available, we use a country-by-country cumulative CO2 series going back to 1750. A full explanation of the characteristics of the data set used is in Appendix 1. We matched and interpolated the country data from the Potsdam Institute for Global Climate Research, the most consistent and relevant data set, to the IMF’s current member countries.
We ran a simulation of an IMF voting share recalculation with the incorporated data. We used the available data of the cumulative CO2 emissions per country since 1944, updated through 2019, calculated the share per country, and normalized the results. We make the assumption that our formula output is binding, and would not be amended through negotiations.
We divided countries’ share of the Openness variable in the quota formula by their share of cumulative CO2 emissions, and then rescaled the results to sum up to 100 percent. We chose to divide the Openness variable as it represents countries’ trade flows in goods, which are associated with CO2 emissions.
Our adjusted quota formula that factors in emissions share is as follows:
QuotaEm = (0.50*GDP + 0.30*Openness/CumulEm + 0.15*Variability + 0.05*Reserves)^K.
Where:
CumulEm = share of cumulative CO2 emissions (MtCO2e) from 1944 to 2019
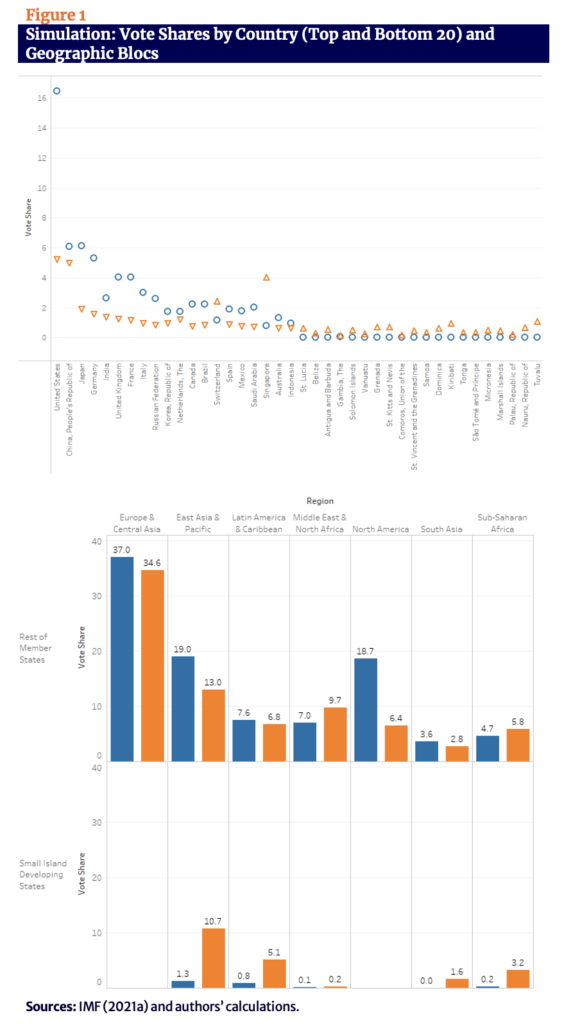
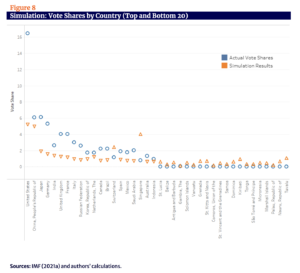
Vote shares calculated according to our climate-weighted formula show reductions for the US and China. The US’s share would decrease from 16.5 to 5.64 percent, and China’s share would drop from 6.1 to 5.36 percent. Other high-income countries, like Japan and Germany, would also see their shares decrease, while the least powerful nations at the IMF would gain votes.
Figure 8
Simulation: Vote Shares by Country (Top and Bottom 20)
By income grouping, the voting share of advanced economies would decrease from 59 to 47 percent, representing a transfer of 12 percent of votes to emerging and developing economies. Low-income countries, specifically, would increase their vote share from 5.2 to 18 percent of votes.
Figure 9
Simulation: Voting Power by Income Grouping and by Geographic Blocs
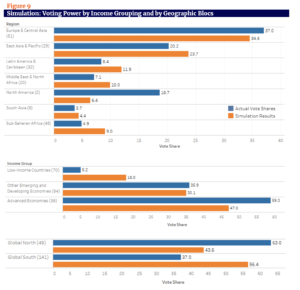
Note: Income categories follow IMF classification, region categories follow World Bank classification, 43 and Global North and South follow Hickel’s (2020) classifications.
Along regional lines, Global South countries would increase their vote share from 37.0 to 56.4 percent, and, in particular, sub-Saharan African countries’ would expand from 4.9 to 9.0 percent.
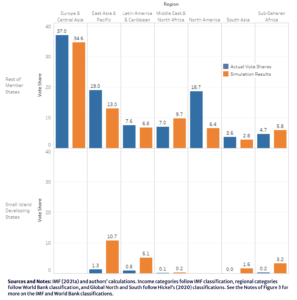
The major winners under this recalculation would be SIDS; their vote share would increase from approximately 2.5 to nearly 21 percent, which adequately reflects the fact that they are highly vulnerable to climate change, especially rising sea levels.
Several high-income secrecy jurisdictions such as Switzerland, Luxembourg, and Singapore, which function as corporate tax havens and offshore banking centers, also would come out as winners in our simulation. This is because they have less relative trade in goods and their economies are highly oriented toward cross-border capital movements. This issue could be addressed by including an additional variable found in the Tax Justice Network’s Corporate Tax Haven Index 44 to the IMF’s “Variability” variable, which considers a country’s capital flows.
Another limitation of our proposal is that it does not consider population as a variable in the formula. Emerging and developing countries, historically, have requested the inclusion of population, which would increase their relative position in the IMF. The IMF’s response, on record, is that it deals with monetary issues, which are unrelated to population. 45
The climate crisis requires substantial mobilization of international resources in order to sufficiently address a challenge of this scale. Yet a country’s power in the global financial system is not tied to, and is in fact inversely related to, its share of responsibility for the climate crisis and its vulnerability to it. Advanced economies — 36 high-income countries as categorized by the IMF — are responsible for approximately 44 percent of cumulative global CO2 emissions since 1944. For the IMF to adequately provide climate financing solutions, its governance structure needs to take into account member countries’ differentiated responsibilities and vulnerabilities in the climate crisis.
Our proposal for IMF governance reform would require dominant state stakeholders to concede large portions of their current voting shares and reallocate their decision-making powers; as such, a structural reform of this magnitude is unlikely to proceed through the IMF’s current
governance processes. However, we believe that calls for this sort of reform, which stem from the “common but differentiated responsibility” principle ostensibly adopted by the international community, are critical in our climate emergency. With each country’s cumulative emissions taken into account under our adjusted formula, decision-making power would shift to countries most impacted by climate change, and all countries would be incentivized to cut emissions.
At the 2020 Annual Meeting of the IMF Board of Governors, IMF Managing Director Kristalina Georgieva described the economic challenges facing our current world — including the pandemic, climate change, and global economic pressures — and ended with a call to action: “Today we face a new Bretton Woods ‘moment.’” Just as the architects of Bretton Woods faced postwar economic destruction in 1944 with an imperative to rebuild, so must we act to address the climate crisis threatening our twenty-first century global economy and our planet. We must understand such an emergency as not only a crisis, but an opportunity to remake and update our global governance structures to be equitable and representative of their full membership. As Georgieva says, “Just as the pandemic has shown that we can no longer ignore health precautions, we can no longer afford to ignore climate change … We focus on climate change because it is macro-critical, posing profound threats to growth and prosperity. It is also people-critical and planet-critical.” 46 [Emphasis in the original.]
A new Bretton Woods moment, therefore, must uphold a new distribution of power, breaking with, in the words of Kevin Gallagher and Richard Kozul-Wright, the “powerful vested interests that have woven strong political alliances around support for footloose capital, rent-seeking corporations, and a carbonized economy.” 47 As was necessary for effective postwar reconstruction, today’s international financial and monetary institutions must allow for new configurations of decision-making organized around climate financing as an urgent priority. By highlighting the gap between international commitments to resolving the climate crisis and the governance structures of institutions tasked with addressing it, actors within the multilateral system can begin to propose such reforms. If the climate emergency is to be taken seriously as a “macro-critical” risk to the global economy, major change is urgently needed in global economic governance. The IMF is a good place to start.
CO2 Emissions Data and Interpolation Technique
For this analysis, we use the PRIMAPHIST database of cumulative greenhouse gas emissions from the Potsdam Institute for Climate Impact Research (PIK). 48 PRIMAPHIST contains data for each United Nations Framework Convention on Climate Change (UNFCCC) country for all greenhouse gases and main emission categories. It includes data from 1750 to 2019, though data for all countries, gases, and emissions categories is not available for the entire period. Our analysis covers the years 1944–2019, which captures data for most countries. We chose 1944, the founding year of the IMF, as a start date; as the adjusted formula is to be used in calculating a country’s voting share at the IMF, a country’s cumulative emissions since 1944 would represent a country’s contributions to global emissions for the duration of the IMF’s existence.
We accessed the PIK data through the Climate Watch data platform 49 by setting the data source as “PIK,” the calculation as “cumulative across available years,” and adjusting the slider to the start date, “1944.” We chose PIK as a data source over others due to the greater breadth of information available per country per year. Other alternative authoritative sources include the UNFCCC, the Global Carbon Project, the Emissions Database for Atmospheric Research, and the Intergovernmental Panel on Climate Change.
To calculate the share of cumulative CO2 per country in this analysis, we divided each IMF member state’s share by the cumulative CO2 emissions of all UNFCCC countries. We include one share for the sum of all non-IMF members (approximately 0.5 percent).
We made some adjustments to country emissions data. The PRIMAPHIST database does not include data for Kosovo, a member of the IMF. This is likely due to a lack of available reporting. To account for this, we used the share of Serbia’s cumulative emissions corresponding to Kosovo’s population, and subtracted it from Serbia’s total. The database also separately measures the emissions of China, Hong Kong, Macau, and Taiwan; we combined the first three. We also combined the emissions of the respective overseas territories of the United Kingdom and the Netherlands with these countries.
As previously noted, voting power at the IMF is based on quota shares, which are calculated from the nonbinding formula and then renegotiated between member states. Our simulation operates under the assumption that our revised formula output would be binding.
Formulas and Country-by-Country Tables for Simulation Methodology
We used a simple linear regression to test if Openness significantly predicted cumulative emissions (CumulEm). We ran the regression using absolute values for Openness denominated in Special Drawing Rights, as published by the IMF. 50 For cumulative emissions, we used absolute values for CO2 expressed in MtCO2e. The fitted regression model was: y = 0.0619x. The correlation was positive and significant (R2 = 0.8098).
Figure B1 Cumulative emissions (MtCO2e) versus Openness
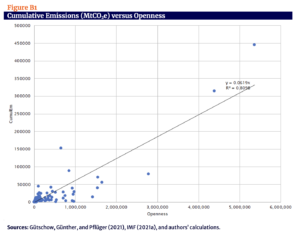
We divided countries’ share of the Openness variable in the quota formula by their shares of cumulative CO2 emissions, and then renormalized the results to sum up to 100 percent. We calculated voting shares using the revised quota formula with basic votes included.
Our adjusted quota formula is as follows:
QuotaEm = (0.50*GDP + 0.30*Openness/CumulEm + 0.15*Variability + 0.05*Reserves)^K.
Where:
CumulEm = share of cumulative CO2 emissions (MtCO2e) from 1944 to 2019
Table 1
Actual and Simulated Vote Shares at the IMF, for Each Member Country
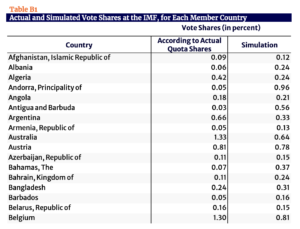
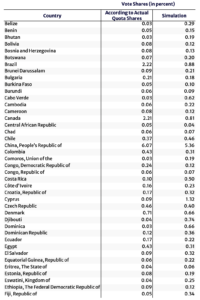
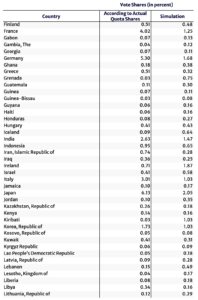
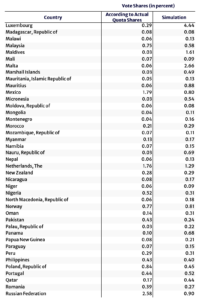
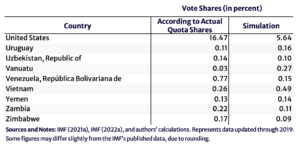
Sources: IMF (2021a), IMF (2022a), and authors’ calculations.
Note: Represents data updated through 2019. Some figures may differ slightly from the IMF’s published data, due to rounding.
Bhattacharya, Amar, Homi Kharas, and John W. McArthur. 2022. “Why Developing Country Voices Will Shape the Global Climate Agenda.” Washington, DC: Brookings Institution, July. https://www.brookings.edu/wp-content/uploads/2022/07/Green_Transitions.pdf
Blomberg, Brock, and J. Lawrence Broz. 2013. “The Political Economy of IMF Voting Power and Quotas.” Political Economy of International Organization, July 29. https://www.peio.me/wp-content/uploads/2014/04/Conf7_Blomberg-Broz-26.08.2013.pdf
Buis, Alan. 2019. “The Atmosphere: Getting a Handle on Carbon Dioxide.” US National Aeronautics and Space Administration October 9.
https://climate.nasa.gov/news/2915/the-atmosphere-getting-a-handle-on-carbon-dioxide/#:~:text=Carbon%20dioxide%20is%20a%20different,timescale%20of%20many%
20human%20lives.
Carbon Brief. 2015. “Interactive: The UNFCCC Negotiating Alliances.” November 27. https://www.carbonbrief.org/interactive-the-negotiating-alliances-at-the-paris-climate-conference/
Climate Watch. N.d. “Historical GHG Emissions.” Accessed October 2022. https://www.climatewatchdata.org/ghg-emissions?end_year=2019&source=PIK&start_year=1850
Evans, Simon. 2021. “Analysis: Which Countries Are Historically Responsible for Climate Change?” London: Carbon Brief, May 10. https://www.carbonbrief.org/analysis-which-countries-are-historically-responsible-for-climate-change/
Farand, Chloé. 2022. “EU Opens the Door to a Loss and Damage Facility – if China Contributes.” Euractiv, November 17. https://www.euractiv.com/section/climate-environment/news/eu-opens-the-door-to-a-loss-and-damage-facility-if-china-contributes/
Fresnillo, Iolanda and Ilaria Crotti. 2022. “Riders on the Storm – How Debt and Climate Change Are Threatening the Future of Small Island Developing States.” Brussels: European Network on Debt and Development October 11. https://www.eurodad.org/debt_in_sids
Galant, Michael. 2022. “Lawmakers from Around the World Discuss Power of SDRs for Global Climate Finance.” Washington, DC: Center for Economic and Policy Research, June 7. https://cepr.net/lawmakers-from-around-the-world-discuss-power-of-sdrs-for-global-climate-finance/
Gallagher, Kevin, and Richard Kozul-Wright. 2021. The Case for a New Bretton Woods. United Kingdom: Polity Press.
Georgieva, Kristalina. 2020. “A New Bretton Woods Moment.” Washington, DC: International Monetary Fund, October 15. https://www.imf.org/en/News/Articles/2020/10/15/sp101520-a-new-bretton-woods-moment
Georgieva, Kristalina and Patrick Verkooijen. 2021. “Op-ed: We Have a Final Opportunity to Respond to Climate Change. Will We Take It?” CNBC, September 13. https://www.cnbc.com/2021/09/13/op-ed-we-have-a-final-opportunity-to-respond-to-climate-change.html
Gütschow, Johannes, Annika Günther, and Mika Pflüger. 2021. “The PRIMAP-hist National Historical Emissions Time Series (1750-2019) v2.3.1.” Zenodo, September 22. https://doi.org/10.5281/zenodo.5494497
Gütschow, Johannes, M. Louise Jeffery, Robert Gieseke, Ronja Gebel, David Stevens, Mario Krapp, and Marcia Rocha. 2016. “The PRIMAP-hist National Historical Emissions Time Series.” Earth System Science Data, 8, 571–603. https://doi.org/10.5194/essd-8-571-2016
Hickel, Jason. 2020. “Quantifying National Responsibility for Climate Breakdown: An Equality-Based Attribution Approach for Carbon Dioxide Emissions in Excess of the Planetary Boundary.” London: Lancet Planet Health: 4: e399–404, September. https://www.thelancet.com/journals/lanplh/article/PIIS2542-5196%2820%2930196-0/fulltext
IEA (International Energy Agency). 2021. “Global Energy Review 2021.” https://www.iea.org/reports/global-energy-review-2021
IMF (International Monetary Fund). 2010. “IMF Executive Board Approves Major Overhaul of Quotas and Governance.” Press Release No. 10/418, November 5. https://www.imf.org/en/News/Articles/2015/09/14/01/49/pr10418
_____. 2012. Updated IMF Quota Data—August 2012. August 8. https://www.imf.org/external/np/fin/quotas/2012/0812.htm
_____. 2016. “Quotas—Data Update and Simulations.” September. https://www.imf.org/external/np/pp/eng/2016/080916.pdf
_____. 2020. “IMF Articles of Agreement.” March. https://www.imf.org/external/pubs/ft/aa/pdf/aa.pdf
_____. 2021a. “Updated IMF Quota Data—July 30 2021.” November 29. https://www.imf.org/external/np/fin/quotas/2021/0730.htm
_____. 2021b. “By-Laws, Rules and Regulations.” Sixty-Sixth Issue, December. https://www.imf.org/external/pubs/ft/bl/blcon.htm
_____. 2022a. “IMF Members’ Quotas and Voting Power, and IMF Board of Governors.” Accessed October 2022. https://www.imf.org/en/About/executive-board/members-quotas
_____. 2022b. “IMF Quota and Governance Publications.” https://www.imf.org/external/np/fin/quotas/pubs/
_____. 2022c. “IMF Quotas.” Accessed October 2022. https://www.imf.org/en/About/Factsheets/Sheets/2022/IMF-Quotas
_____. 2022d. “Proposal to Establish a Resilience and Sustainability Trust.” April. https://www.imf.org/-/media/Files/Publications/PP/2022/English/PPEA2022013.ashx
______.2022e. “World Economic Outlook: Database—WEO Groups and Aggregates Information.” April. https://www.imf.org/external/pubs/ft/weo/2022/01/weodata/groups.htm
Khor, Martin. 2012. “Rich Nations Backtracking on the Road to Rio Summit.” TWN Rio+20 News Update 1, June 13. https://www.twn.my/title2/rio+20/news_updates/TWN_update1.pdf
Kung, Hilary. 2022. “Developing Countries Stress Importance of Equity in the Global Stocktake.” In Bonn Climate News Update, 31–35. Penang: Third World Network Berhad, June 14. https://twn.my/title2/climate/fullpdf/BonnClimateJune22complete.pdf
Latindadd (Red Latinoamericana por Justicia Económica y Social). 2021. “CSO Launches Call for the Fair Channeling of Special Drawing Rights / OSC lanza llamado para la canalización justa de los Derechos Especiales de Giro.” September 29. https://www.latindadd.org/2021/09/29/osc-launches-call-for-the-fair-channeling-of-special-drawing-rights-osc-lanza-llamado-para-la-canalizacion-justa-de-los-derechos-especiales-de-giro/
Merling, Lara. 2022. “No Voice for the Vulnerable: Climate Change and The Need for Quota Reform at the IMF.” Global Economic Governance Initiative Working Paper 057. Boston: Global Development Policy Center, Boston University, October 13. https://www.bu.edu/gdp/files/2022/10/GEGI_WP_057_FIN.pdf
Mohan, Rakesh. 2020. “IMF Quota Reforms and Global Economic Governance: What Does the Future Hold?” Working Paper 2. New Delhi: Center for Social and Economic Progress, October. https://csep.org/wp-content/uploads/2020/10/IMF-working-paper_F-1.pdf
Mohan, Rakesh and Muneesh Kapur. 2015. “Emerging Powers and Global Governance: Whither the IMF?” IMF Working Paper 15/219. Washington, DC: International Monetary Fund, October. https://www.imf.org/external/pubs/ft/wp/2015/wp15219.pdf
Montes, Manuel. 2021. “Mobilising Climate Financing from SDRs: Some Reflections.” Third World Resurgence No. 349, 38–45. https://twn.my/title2/resurgence/2021/349/cover03.htm
Pettifor, Ann. 2017. The Production of Money: How to Break the Power of Bankers. London, England: Verso Books.
Petro, Gustavo (@petrogustavo). 2022. “Este es el decálogo que propuse en la COP27 de Egipto, como acción para enfrentar la crisis climática del mundo.” Twitter, November 7, 3:47 p.m. https://twitter.com/petrogustavo/status/1589721222677688320
Sanford, Jonathan E. and Weiss, Martin A. 2004. “How Will the IMF Select Its New Managing Director?” April. https://ssrn.com/abstract=540504
Shalal, Andrea and David Lawder. 2022. “Yellen Says New IMF SDR Allocation Not Appropriate at This Time.” Reuters, October 14. https://www.reuters.com/markets/asia/yellen-says-new-imf-sdr-allocation-not-appropriate-this-time-2022-10-14/
Tax Justice Network. 2021. “Corporate Tax Haven Index – 2021 Results.” https://cthi.taxjustice.net/en/
Third World Network. 2022a. “COP 27 Delivered on Its Promise – Say Developing Countries.” TWN Sharm El-Sheikh Climate News Update No. 13, November 22. https://wp.twnnews.net/sendpress/email/?sid=NjQxNzA&eid=NTU0Ng
_____. 2022b. “Negotiations Shift into High Gear.” TWN Sharm El-Sheikh Climate News Update No. 9, November 15. https://twn.my/title2/climate/info.service/2022/cc221111.htm
UN (United Nations). 1949. “World Economic Report, 1948.” Department of Economic Affairs, June. https://www.un.org/en/development/desa/policy/wess/wess_archive/searchable_archive/1948_WESS_Full.pdf
_____. 1992. “Report of the United Nations Conference on Environment and Development.” General Assembly. A/CONF.151/26 (Vol. I). Rio de Janeiro, August 12. https://www.un.org/en/development/desa/population/migration/generalassembly/docs/globalcompact/A_CONF.151_26_Vol.I_Declaration.pdf
_____. 2019. “UN Report: Nature’s Dangerous Decline ‘Unprecedented’; Species Extinction Rates ‘Accelerating.’” Sustainable Development Goals, May 6. https://www.un.org/sustainabledevelopment/blog/2019/05/nature-decline-unprecedented-report/
_____. 2022. “COP27: What You Need to Know about This Year’s Big UN Climate Conference.” UN News, October 28. https://news.un.org/en/story/2022/10/1129947
_____. N.d. “List of SIDS.”. Office of the High Representative for the Least Developed Countries, Landlocked Developing Countries and Small Island Developing States. Accessed December 2, 2022. https://www.un.org/ohrlls/content/list-sids
UNECA (United Nations Economic Commission for Africa). 2022. “The Dice Is Loaded Against Africa: Ministers Call for Reform.” May 17. https://www.uneca.org/stories/the-dice-is-loaded-against-africa-ministers-call-for-reform
UNEP (United Nations Environment Programme). 2021. “Step Up Climate Change Adaptation or Face Serious Human and Economic Damage – UN Report.” January 14. https://www.unep.org/news-and-stories/press-release/step-climate-change-adaptation-or-face-serious-human-and-economic
Van Houtven, Leo. 2002. “Governance of the IMF: Decision Making, Institutional Oversight, Transparency, and Accountability.” Pamphlet Series No. 53. Washington, DC: International Monetary Fund, August. https://www.imf.org/external/pubs/ft/pam/pam53/pam53.pdf
Vasic-Lalovic, Ivana. 2022. “The Case for More Special Drawing Rights: Rechanneling Is No Substitute for a New Allocation.” Washington, DC: Center for Economic and Policy Research, October 13. https://cepr.net/report/the-case-for-more-special-drawing-rights/
Weisbrot, Mark and Jake Johnston. 2016. “Voting Share Reform at the IMF: Will it Make a Difference?” Washington, DC: Center for Economic and Policy Research, April. https://cepr.net/images/stories/reports/IMF-voting-shares-2016-04.pdf
World Bank. 2022. “World Bank Country and Lending Groups.” Accessed December 5, 2022. https://datahelpdesk.worldbank.org/knowledgebase/articles/906519-world-bank-country-and-lending-groups
Wyeth Earnest, Natalie. 2014. “Myth vs. Fact: Why IMF Quota and Governance Reforms Are Urgently Needed.” Treasury Notes (blog). US Department of the Treasury, March 14. Archived. https://web.archive.org/web/20140318004107/http://www.treasury.gov:80/connect/blog/Pages/Myth-vs-Fact-IMF-Quota-Reforms.aspx
