When Donald Trump ran in 2016, he said that if he got elected, we would get tired of winning. When it comes to the economy, it looks like Trump was right, but only after he was out of office for three years.
It would be hard to find a time in the last half century when the economic picture looked so bright. The economy grew 3.1 percent over the last year, a period for which most forecasters were predicting a recession. Unemployment has been below 4.0 percent for 23 consecutive months, the longest stretch since the late 1960s.
Real wages are now rising at a healthy pace with the largest gains going to those at the bottom of the wage distribution. As a result of the tight labor market, workers’ job satisfaction is at a record high. Productivity growth looks like it may be on a higher path. Inflation looks like it has fallen back to the Fed’s 2.0 percent target. And, thanks to the Inflation Reduction Act, we are finally taking some big steps to slow global warming.
This is all really good news that would likely impress most people if they could find out about it, but there is even more. Healthcare costs have stopped rising as a share of GDP and have even declined some in recent years.
The Golden Age of Deficit Hawks
If that doesn’t sound like a big deal to you, then you didn’t live through the Golden Age of Deficit Hawks. Back in the 1990s and through the next decade, the very serious people of both political parties insisted that the deficit and debt were exploding and that they would bankrupt the country if we didn’t do things like cut Social Security and Medicare very soon.
While it was not generally appreciated at the time, most of their projections for fiscal doom were based on projections for exploding healthcare costs. This projected explosion of health care costs was based on exploding private sector healthcare costs. However, this implied huge budget deficits, since the government pays for close to half of all healthcare through programs like Medicare and Medicaid.
If you want to get a taste for these times, read that deficit hawk classic, Will America Grow Up Before It Grows Old: How the Coming Social Security Crisis Threatens You, Your Family, and Your Country, by private equity billionaire Peter Peterson. For more cheap fun, check out the review in the New York Times by a prominent economist (who promptly apologized and owned up to his mistake.)
The Health Care Cost Explosion Didn’t Happen
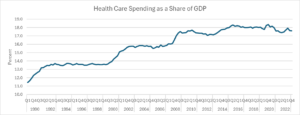
The deficit hawks have not gone away, but the healthcare cost explosion, which was the basis for their warnings 30 years ago, never came. Healthcare spending as a share of GDP rose from 11.4 percent in 1990 to 13.6 percent of GDP at the end of 1999.[1] It then rose further to 17.3 percent of GDP by 2010.
Source: National Income and Product Accounts and Author’s Calculations, see note.
However, since 2010 healthcare spending has changed little as a share of GDP. It was just 17.6 percent of GDP in 2023. In fact, spending in recent years has been down somewhat from its pre-pandemic peak of 18.3 percent in 2016.
The year 2010 is notable because that was the year that Obamacare was passed into law. It would be wrong to claim that Obamacare was the sole reason for the slowing of healthcare cost growth. Costs slowed in most other wealthy countries too. But Obamacare almost certainly contributed to the slowing here.
Also, as a political matter, no one can doubt for a second that if costs had gone the other way, that the Democrats would be held fully responsible for rising healthcare costs. That would be the case even if every other wealthy had a larger increase, a story that we just saw with the pandemic inflation.
Lower Healthcare Costs Are Big Money
Seeing fractions of GDP may hide the amount of money involved in these healthcare cost savings. If we were spending 18.3 percent of GDP on healthcare, as we did in 2016, instead of the current 17.6 percent, that would amount to another $196 billion going to healthcare spending this year. That comes to almost $600 a person or $2,400 for a family of four.
The savings are even larger compared to a scenario where health care costs had continued to grow at their pre-2010 pace. Healthcare spending as a share of GDP rose by 5.9 percentage points between 1990 and 2010. If the share had continued to grow at this pace, healthcare spending would have been 21.4 percent of GDP in 2023, 3.8 percentage points above its current level.
Compared to that benchmark we are saving $1,060 billion a year on healthcare costs. That comes to $3,200 a person in annual savings or $12,800 for a family of four. That is big money by almost any standard.
Hey, Where Are My Savings?
People seeing these calculations can reasonably be complaining that they didn’t see any savings on healthcare. And, in fact they didn’t. These are savings measured against projected cost growth. It turns out that the projections were wrong, whether that was due to good policy or bad projections is not easy to say.
In any case, it’s understandable that people wouldn’t get too excited about savings compared to projections that they know nothing about. It is worth saying here that, at the time, these projections were taken very seriously by people in policy debates across the political spectrum.
If someone debating budget policy in 2010 had substituted the actual course of health care cost growth for the next 13 years, that we now know, in place of the projections being used at the time, they would have been laughed off the stage. We can at least say that we are hugely better off than if the experts had been right in 2010 about the future course of healthcare cost growth.
There are two other important points to be made about these healthcare spending numbers. First, most of us don’t directly pay for most of our healthcare. Most of us have insurance, either through our employer or the government.
While what our employer pays for insurance is reflected to some extent in our pay, and government payments show up in overall spending and deficits, we don’t directly see the healthcare costs we incur. This means that if our employer ends up paying five or ten percent less for insurance, we may never directly see these savings, even if some of the savings do eventually show up in our paychecks.
The other point is a bit tricky. At the end of the day, we don’t really care about buying health care services, we care about our health. No one is happy about having more doctors visits or medical tests, they are happy about being in good health. Most people would be very happy if they could have good health with less medical care.
The question that has to be asked in the context of these savings is whether the quality of care and public health has deteriorated since 2010. There is evidence that public health has gotten worse by some important measures, like life expectancy, in the last 13 years. Anne Case and Angus Deaton documented the rise of “deaths of despair” in the deindustrialized Midwest. However, this rise predates Obamacare. The deterioration in health for a substantial segment of the population can’t in any obvious way be attributed to changes put in place by the Affordable Care Act (ACA).
It is common for people to complain about wait times to see doctors and bureaucratic hoops insurers put patients through in order to get tests or see specialists. While these are bad features of our healthcare system, these problems existed long before the passage of the ACA. It’s possible that they have gotten worse, but few people with serious health issues would have been happy about their dealings with insurers in 2010.
Finally, it is worth noting that even with the slower increases in healthcare cost growth since the ACA was passed, we are still paying almost twice as much per person for our healthcare. And, we have little to show for this extra spending in terms of better outcomes. In short, there is still plenty to complain about with our healthcare system.
Nonetheless, we should be happy for the good news – the projected healthcare cost explosion never came. And, with a bit of luck our healthcare costs may actually come down a bit. Some efforts by the Biden administration, such as reducing drug prices and restraining monopoly power for large insurers and other big actors in the industry, may prove helpful in this respect, but we have a very long way to go to get our costs in line with other wealthy countries.
[1] These numbers are slightly higher than what the Centers for Medicare and Medicare Services (CMS) report for healthcare spending as a share of GDP. They showed a figure of 17.3 percent for 2022 (the last year for which data are available), while my calculations come to 17.5 percent. I assume this is due to some double counting, where I may have some government healthcare spending, which also shows up as consumption. For those wanting to check, I added lines 64, 119, 170, and 273 from NIPA Table 2.4.5U and line 32 from NIPA Table 3.12U. These are therapeutic equipment, pharmaceuticals and other medical products, healthcare services, and net health care insurance. Line 32 is the government spending on Medicaid and other healthcare provision. Although the level is somewhat higher than the CMS data indicate presumably the changes over this period follow the changes as measured by CMS reasonably closely.
When Donald Trump ran in 2016, he said that if he got elected, we would get tired of winning. When it comes to the economy, it looks like Trump was right, but only after he was out of office for three years.
It would be hard to find a time in the last half century when the economic picture looked so bright. The economy grew 3.1 percent over the last year, a period for which most forecasters were predicting a recession. Unemployment has been below 4.0 percent for 23 consecutive months, the longest stretch since the late 1960s.
Real wages are now rising at a healthy pace with the largest gains going to those at the bottom of the wage distribution. As a result of the tight labor market, workers’ job satisfaction is at a record high. Productivity growth looks like it may be on a higher path. Inflation looks like it has fallen back to the Fed’s 2.0 percent target. And, thanks to the Inflation Reduction Act, we are finally taking some big steps to slow global warming.
This is all really good news that would likely impress most people if they could find out about it, but there is even more. Healthcare costs have stopped rising as a share of GDP and have even declined some in recent years.
The Golden Age of Deficit Hawks
If that doesn’t sound like a big deal to you, then you didn’t live through the Golden Age of Deficit Hawks. Back in the 1990s and through the next decade, the very serious people of both political parties insisted that the deficit and debt were exploding and that they would bankrupt the country if we didn’t do things like cut Social Security and Medicare very soon.
While it was not generally appreciated at the time, most of their projections for fiscal doom were based on projections for exploding healthcare costs. This projected explosion of health care costs was based on exploding private sector healthcare costs. However, this implied huge budget deficits, since the government pays for close to half of all healthcare through programs like Medicare and Medicaid.
If you want to get a taste for these times, read that deficit hawk classic, Will America Grow Up Before It Grows Old: How the Coming Social Security Crisis Threatens You, Your Family, and Your Country, by private equity billionaire Peter Peterson. For more cheap fun, check out the review in the New York Times by a prominent economist (who promptly apologized and owned up to his mistake.)
The Health Care Cost Explosion Didn’t Happen
The deficit hawks have not gone away, but the healthcare cost explosion, which was the basis for their warnings 30 years ago, never came. Healthcare spending as a share of GDP rose from 11.4 percent in 1990 to 13.6 percent of GDP at the end of 1999.[1] It then rose further to 17.3 percent of GDP by 2010.
Source: National Income and Product Accounts and Author’s Calculations, see note.
However, since 2010 healthcare spending has changed little as a share of GDP. It was just 17.6 percent of GDP in 2023. In fact, spending in recent years has been down somewhat from its pre-pandemic peak of 18.3 percent in 2016.
The year 2010 is notable because that was the year that Obamacare was passed into law. It would be wrong to claim that Obamacare was the sole reason for the slowing of healthcare cost growth. Costs slowed in most other wealthy countries too. But Obamacare almost certainly contributed to the slowing here.
Also, as a political matter, no one can doubt for a second that if costs had gone the other way, that the Democrats would be held fully responsible for rising healthcare costs. That would be the case even if every other wealthy had a larger increase, a story that we just saw with the pandemic inflation.
Lower Healthcare Costs Are Big Money
Seeing fractions of GDP may hide the amount of money involved in these healthcare cost savings. If we were spending 18.3 percent of GDP on healthcare, as we did in 2016, instead of the current 17.6 percent, that would amount to another $196 billion going to healthcare spending this year. That comes to almost $600 a person or $2,400 for a family of four.
The savings are even larger compared to a scenario where health care costs had continued to grow at their pre-2010 pace. Healthcare spending as a share of GDP rose by 5.9 percentage points between 1990 and 2010. If the share had continued to grow at this pace, healthcare spending would have been 21.4 percent of GDP in 2023, 3.8 percentage points above its current level.
Compared to that benchmark we are saving $1,060 billion a year on healthcare costs. That comes to $3,200 a person in annual savings or $12,800 for a family of four. That is big money by almost any standard.
Hey, Where Are My Savings?
People seeing these calculations can reasonably be complaining that they didn’t see any savings on healthcare. And, in fact they didn’t. These are savings measured against projected cost growth. It turns out that the projections were wrong, whether that was due to good policy or bad projections is not easy to say.
In any case, it’s understandable that people wouldn’t get too excited about savings compared to projections that they know nothing about. It is worth saying here that, at the time, these projections were taken very seriously by people in policy debates across the political spectrum.
If someone debating budget policy in 2010 had substituted the actual course of health care cost growth for the next 13 years, that we now know, in place of the projections being used at the time, they would have been laughed off the stage. We can at least say that we are hugely better off than if the experts had been right in 2010 about the future course of healthcare cost growth.
There are two other important points to be made about these healthcare spending numbers. First, most of us don’t directly pay for most of our healthcare. Most of us have insurance, either through our employer or the government.
While what our employer pays for insurance is reflected to some extent in our pay, and government payments show up in overall spending and deficits, we don’t directly see the healthcare costs we incur. This means that if our employer ends up paying five or ten percent less for insurance, we may never directly see these savings, even if some of the savings do eventually show up in our paychecks.
The other point is a bit tricky. At the end of the day, we don’t really care about buying health care services, we care about our health. No one is happy about having more doctors visits or medical tests, they are happy about being in good health. Most people would be very happy if they could have good health with less medical care.
The question that has to be asked in the context of these savings is whether the quality of care and public health has deteriorated since 2010. There is evidence that public health has gotten worse by some important measures, like life expectancy, in the last 13 years. Anne Case and Angus Deaton documented the rise of “deaths of despair” in the deindustrialized Midwest. However, this rise predates Obamacare. The deterioration in health for a substantial segment of the population can’t in any obvious way be attributed to changes put in place by the Affordable Care Act (ACA).
It is common for people to complain about wait times to see doctors and bureaucratic hoops insurers put patients through in order to get tests or see specialists. While these are bad features of our healthcare system, these problems existed long before the passage of the ACA. It’s possible that they have gotten worse, but few people with serious health issues would have been happy about their dealings with insurers in 2010.
Finally, it is worth noting that even with the slower increases in healthcare cost growth since the ACA was passed, we are still paying almost twice as much per person for our healthcare. And, we have little to show for this extra spending in terms of better outcomes. In short, there is still plenty to complain about with our healthcare system.
Nonetheless, we should be happy for the good news – the projected healthcare cost explosion never came. And, with a bit of luck our healthcare costs may actually come down a bit. Some efforts by the Biden administration, such as reducing drug prices and restraining monopoly power for large insurers and other big actors in the industry, may prove helpful in this respect, but we have a very long way to go to get our costs in line with other wealthy countries.
[1] These numbers are slightly higher than what the Centers for Medicare and Medicare Services (CMS) report for healthcare spending as a share of GDP. They showed a figure of 17.3 percent for 2022 (the last year for which data are available), while my calculations come to 17.5 percent. I assume this is due to some double counting, where I may have some government healthcare spending, which also shows up as consumption. For those wanting to check, I added lines 64, 119, 170, and 273 from NIPA Table 2.4.5U and line 32 from NIPA Table 3.12U. These are therapeutic equipment, pharmaceuticals and other medical products, healthcare services, and net health care insurance. Line 32 is the government spending on Medicaid and other healthcare provision. Although the level is somewhat higher than the CMS data indicate presumably the changes over this period follow the changes as measured by CMS reasonably closely.
Read More Leer más Join the discussion Participa en la discusión
Yes, that was the New York Times told us this morning, or at least part of what they told us. The piece, headlined “more renters than ever before are burdened by the rent they pay.” The basis for the article was a new report by Harvard’s Joint Center for Housing Studies, which found that more than half of all renters pay more than 30 percent of their income for rent.
The first paragraph lays out the picture:
“Half of all renters in the United States spend more than 30 percent of their income on rent and utilities, more than at any other time in history, according to a new report by Harvard’s Joint Center for Housing Studies.”
Later in the article the piece tells us that, according to Apartment List, rents have risen by 19.0 percent since the start of the pandemic. According to the Bureau of Labor Statistics (BLS), the average hourly wage for all workers has increased by 20.0 percent since the start of the pandemic. This means that rents on average, increased by 1.0 percentage points less than wages.
Hourly wages for production and non-supervisory workers, a category that excludes higher paid professionals and managers, have increased 22.4 percent since the start of the pandemic. This puts their pay increase more than 3.0 percentage points above the rent increase cited in the article.
It is possible to tell a somewhat worse story on rental inflation. The BLS measure of rents, which includes all occupied units, not just the ones changing hands, increased by 21.2 percent since the start of the pandemic. This would put the rent increase slightly above the increase in average wages for all workers, but still more than a full percentage point below the rise in wages for production and non-supervisory workers.
Read More Leer más Join the discussion Participa en la discusión
Major media outlets continually push the theme that young people can’t buy homes even though a larger share of households headed by someone under age 35 own homes today than when Donald Trump was in the White House. CNN pushed its entry into the contest for the best “Death of the American Dream” piece last week, with an article headlined “What Broke the American Dream for Millennials.”
CNN hoped to get extra credit for this segment about student loan debt burdens:
“I think a lot of Millennials were forced into saying, ‘you need a four-year degree in order to be successful,’” says Rachael, who is 33. “At 18, you’re signing up to be $100,000 in debt before you even really know how to make the best decisions for yourself. I think we need to change that narrative.”
This quote was really impressive for two reasons. First, almost no one borrows $100,000 to get a bachelors degree. The average amount borrowed to get four-year degree at a public university was $32,637, so CNN’s authority here is giving readers a number that is more than three times the average.
The other reason the quote is impressive is that they are telling us that “we need to change that narrative” [on student loan debt.] This is impressive because we actually did change the narrative, which CNN’s reporters would know if they had access to government web sites.
Under President Biden’s income-driven repayment plan, a single person earning less than $32,800 a year would pay nothing towards their loan. If their income rose to $40,000, they would pay $60 a month and at $50,000 a year they would pay $143 a month. Many borrowers would have their loans forgiven after being in the program for ten years.
CNN’s competitors for the award include the Washington Post’s entry “Millennials have found a way to buy houses: Living with mom and dad,” the New York Times entry “American Dream Deferred: Why Housing Prices May Pose a Problem for Biden,” as well as two earlier entries from the NYT: ‘It’s Never Our Time’: First-Time Home Buyers Face a Brutal Market,” and “Older, White and Wealthy Home Buyers Are Pushing Others Out of the Market.”
For those interested in the realities of the housing market, homeownership rates for people under age 35 are actually above their pre-pandemic level as shown below.
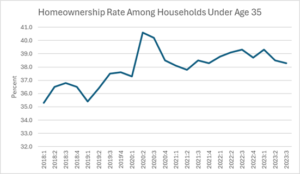
Source: Census Bureau, Table 6.
Homeownership rates are also higher for Blacks, Hispanics, and households with less than the median income. But you would have to have access to the Census Bureau’s website to have this information.
To be clear, if interest rates stay high, the homeownership rate for the young and other disadvantaged groups is likely to fall, but few are expecting that we will continue to see high mortgage rates.
Major media outlets continually push the theme that young people can’t buy homes even though a larger share of households headed by someone under age 35 own homes today than when Donald Trump was in the White House. CNN pushed its entry into the contest for the best “Death of the American Dream” piece last week, with an article headlined “What Broke the American Dream for Millennials.”
CNN hoped to get extra credit for this segment about student loan debt burdens:
“I think a lot of Millennials were forced into saying, ‘you need a four-year degree in order to be successful,’” says Rachael, who is 33. “At 18, you’re signing up to be $100,000 in debt before you even really know how to make the best decisions for yourself. I think we need to change that narrative.”
This quote was really impressive for two reasons. First, almost no one borrows $100,000 to get a bachelors degree. The average amount borrowed to get four-year degree at a public university was $32,637, so CNN’s authority here is giving readers a number that is more than three times the average.
The other reason the quote is impressive is that they are telling us that “we need to change that narrative” [on student loan debt.] This is impressive because we actually did change the narrative, which CNN’s reporters would know if they had access to government web sites.
Under President Biden’s income-driven repayment plan, a single person earning less than $32,800 a year would pay nothing towards their loan. If their income rose to $40,000, they would pay $60 a month and at $50,000 a year they would pay $143 a month. Many borrowers would have their loans forgiven after being in the program for ten years.
CNN’s competitors for the award include the Washington Post’s entry “Millennials have found a way to buy houses: Living with mom and dad,” the New York Times entry “American Dream Deferred: Why Housing Prices May Pose a Problem for Biden,” as well as two earlier entries from the NYT: ‘It’s Never Our Time’: First-Time Home Buyers Face a Brutal Market,” and “Older, White and Wealthy Home Buyers Are Pushing Others Out of the Market.”
For those interested in the realities of the housing market, homeownership rates for people under age 35 are actually above their pre-pandemic level as shown below.
Source: Census Bureau, Table 6.
Homeownership rates are also higher for Blacks, Hispanics, and households with less than the median income. But you would have to have access to the Census Bureau’s website to have this information.
To be clear, if interest rates stay high, the homeownership rate for the young and other disadvantaged groups is likely to fall, but few are expecting that we will continue to see high mortgage rates.
Read More Leer más Join the discussion Participa en la discusión
Republicans have proudly made themselves the party of chaos. In his tenure as president, Donald Trump was almost gleeful when he took executive actions that made no sense and often contradicted his earlier actions and stated positions.
Republicans have also applied this approach to the legislative branch as they have used their control of the House to block almost all legislation on anything, including efforts to deal with immigration. This is despite the fact that they endlessly yell about immigration as the number one crisis facing the country.
Now the chaos party is looking to take their brand to the judiciary, as Republican justices are debating whether to overturn the Chevron doctrine. The Chevron doctrine dates back to a case brought before the court in 1984.
In that case, Chevron was contesting the Environmental Protection Agency’s (EPA) interpretation of a law passed by Congress in 1977, which required an extensive environmental review for any industrial project that would establish a new stationary source of pollution. The EPA interpreted this law to mean that a significant expansion of any existing source also was subject to an EPA review.
Chevron contested this interpretation, arguing that it was not the precise wording of the law. The court decided in a unanimous decision (i.e. justices appointed by both Republicans and Democrats) that the EPA had acted correctly. The ruling, which became known as the Chevron doctrine, held that a decision by an administrative body, like the EPA, was binding as long as it was a reasonable interpretation of the statute passed by Congress.
The Supreme Court is now hearing a case, Loper Bright Enterprises v. Raimondo, which right-wing legal groups hope will overturn the Chevron case. The issue being contested is whether the National Marine Fisheries Service, a division of the Commerce Department, can require fishing boats to pay the cost of observers placed on their boats to ensure that they are complying with the relevant fishing restrictions.
Loper Bright Enterprises is arguing that this is not a provision written directly into the law. The counterargument from the Commerce Department (Gina Raimondo is the department secretary) is that this requirement is a reasonable interpretation of the laws requiring the Fisheries Service to maintain a sustainable supply of fish over time.
Overturning Chevron is Pro-Chaos, not Pro Business
Much of the discussion around this case treats the prospect of overturning Chevron as being pro-business. While that could be the outcome in this particular case (although the fishing industry is the biggest beneficiary of efforts to ensure a sustainable supply of fish), that would not necessarily be the effect in general.
Laws always contain a substantial element of ambiguity, since it is impossible to lay out in legislation the specific factors that would be relevant in every individual case. This means that it is necessary for someone to determine how the law applies to the specific case in question.
The Chevron doctrine gives considerable authority to the administrative agencies. These agencies are staffed with career civil servants who become experts in specific areas and apply the same principles over many decades. This ensures a large degree of consistency in the law, which businesses can assume in making expansion and investment decisions.
Overturning Chevron does not remove the need to interpret laws, it just takes the power away from the administrative agencies and gives it to judges. This is likely to lead to far less certainty for two reasons.
First, unlike the administrative agencies, the judges making rulings are not going to have expertise in the areas on which they are being asked to make a ruling. The trial court judge making the initial ruling in this case likely knew nothing about sustainable fishing practices.
The same would be the case with countless other issues that routinely get brought before administrative agencies. A judge making a ruling on whether Boeing had complied with relevant safety legislation with its latest 737 plane, likely has no expertise in airline safety, unlike the FAA. A judge making a ruling on the safety of a new drug likely has no expertise on the sort of tests needed to determine a drug’s safety and efficacy, unlike the FDA.
The issue of drug safety brings up the second reason. Sometimes presidents appoint judges, not because they think they would be competent jurists, but because they adhere to a particular ideology.
We saw this recently when U.S. District Judge Matthew Kacsmaryk overturned the FDA’s approval of mifepristone, a drug used to induce abortions, which had been on the market for more than 20 years. Judge Kacsmaryk does not have any special medical expertise, he was a far-right legal scholar appointed by Donald Trump to appease the anti-abortion movement.
It’s likely that Judge Kacsmaryk’s ruling will be overturned by the Supreme Court, it already has been stayed, so his prohibition on mifepristone’s use did not go into effect. But can anyone seriously contend that a world in which any judge can ban any drug that they don’t like, based on no scientific evidence whatsoever, is pro-business?
The pharmaceutical industry exaggerates the cost of developing drugs, but the major drug companies do spend tens of billions of dollars on research each year. Would this spending make sense in a context where any random judge can suddenly prohibit them from selling a drug that has long been established to be safe and effective?
The same story applies to almost every area of business. If the FAA had fully blessed Boeing’s airplane designs and safety tests, would it be good for Boeing if a judge could just ignore all the safety data and tell Boeing its planes are unsafe?
This also goes the other way. Car manufacturers spend hundreds of millions of dollars to comply with safety, pollution, and mileage standards. These companies would have a hard time competing with a new company who found a judge that said these rules don’t apply to them.
Needless to say, businesses don’t like rules that restrain them, but overturning Chevron doesn’t mean that they won’t have rules that restrain them. It just means that they won’t have the consistent enforcement that results from having career civil servants in administrative agencies attempting to apply laws in a uniform manner over time. Instead, they will be subject to random rulings from judges who span the political spectrum.
In short, the overturning of Chevron would be an effort by the Republican Justices to apply the same sort of chaos to the judiciary that the Republican Party has already applied to the executive and legislative branches. This would certainly enhance the Republicans’ ability to run as the party of chaos in 2024, but it would not do much to advance either business interests narrowly or the public interest more generally.
Read More Leer más Join the discussion Participa en la discusión
We have been seeing numerous stories in the media about how people support Donald Trump because he did such a great job with the economy. Obviously, people can believe whatever they want about the world, but it is worth reminding people what the world actually looked like when Trump left office (kicking and screaming) and Biden stepped into the White House.
Trump’s Legacy: Mass Unemployment
The economy had largely shut down in the spring of 2020 because of the pandemic. It was still very far from fully reopening at the point of the transition.
In January of 2021, the unemployment rate was 6.4 percent, up from 3.5 percent before the pandemic hit at the start of the year. A more striking figure than the unemployment rate was the employment rate, the percentage of the population that was working. This had fallen from 61.1 percent to 57.4 percent, a level that was lower than the low point of the Great Recession.
The number of people employed in January of 2021 was nearly 8 million people below what it had been before the pandemic. We see the same story if we look at the measure of jobs in the Bureau of Labor Statistics establishment survey. The number of jobs was down by more than 9.4 million from the pre-pandemic level.
We were also not on a clear path toward regaining these jobs rapidly. The economy actually lost 268,000 jobs in December of 2020. The average rate of job creation in the last three months of the Trump administration was just 163,000.
What the World Looked Like When Donald Trump Left Office
In the fourth quarter of 2020 the economy was still being shaped in a very big way by the pandemic. Most of the closures mandated at the start of the pandemic had been lifted, but most people were not conducting their lives as if the pandemic had gone away. We can see this very clearly in the consumption data.
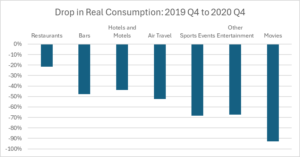
Source: Bureau of Economic Analysis and author’s calculations.
The figure above shows the falloff in consumption between the fourth quarter of 2019 and the fourth quarter of 2020 in some of the areas hardest hit by the pandemic. While overall consumption was down just 0.8 percent, there has been an enormous shift from services to goods.
Inflation-adjusted spending at restaurants was down by 21.5 percent, and much of this spending went for picking up food rather than sit-down meals. Spending at bars was down 47.7 percent. Spending at hotels and motels was down by 43.8 percent as people had hugely cut back travel. Air travel was down 52.4 percent.
Spending on football games, baseball games, and sports events was down by 68.3 percent. Spending on live concerts and other entertainment was down a bit less, at 67.4 percent. And movie going was down 92.7 percent.
The Story of Cheap Gas
Donald Trump and his supporters have often boasted about the cheap gas we had when he was in office. This is true. Gas prices did fall below $2.00 a gallon in the spring of 2020 when the economy was largely shut down, although they had risen above $2.30 a gallon by the time Trump left office. The cause of low prices was hardly a secret, demand in the U.S. and around the world had collapsed. In the fourth quarter of 2020 gas consumption was still 12.5 percent below where it had been before the pandemic.
In fact, gas prices likely would have been even lower in this period if not for Trump’s actions, which he boasted about at the time. Trump claimed to have worked a deal with Russia and OPEC to slash production and keep gas prices from falling further. The sharp cutbacks in production were a major factor in the high prices when the economy began to normalize after President Biden came into office since oil production cannot be instantly restarted.
The End of the Trump Economy Was a Sad Story
Donald Trump handed President Biden an incredibly damaged economy at the start of 2021. People can rightfully say that the problems were due to the pandemic, not Trump’s mismanagement, but the impact of the pandemic did not end on January 21. The problems associated with the pandemic were the main reason the United States, like every other wealthy country, suffered a major bout of inflation in 2021 and 2022.
It is often said that people don’t care about causes, they just care about results. This is entirely plausible, but the results in the last year of the Trump administration were truly horrible by almost any measure.
It may be the case that people are more willing to forgive Trump for the damage the pandemic did to the economy than Biden, but that is not an explanation based on the reality in people’s lives, or “lived experience” to use the fashionable term.
That would mean that for some reason people recognize and forgive Trump for the difficult circumstances he faced as a result of the pandemic, but they don’t with Biden. It would be worth asking why that could be the case.
We have been seeing numerous stories in the media about how people support Donald Trump because he did such a great job with the economy. Obviously, people can believe whatever they want about the world, but it is worth reminding people what the world actually looked like when Trump left office (kicking and screaming) and Biden stepped into the White House.
Trump’s Legacy: Mass Unemployment
The economy had largely shut down in the spring of 2020 because of the pandemic. It was still very far from fully reopening at the point of the transition.
In January of 2021, the unemployment rate was 6.4 percent, up from 3.5 percent before the pandemic hit at the start of the year. A more striking figure than the unemployment rate was the employment rate, the percentage of the population that was working. This had fallen from 61.1 percent to 57.4 percent, a level that was lower than the low point of the Great Recession.
The number of people employed in January of 2021 was nearly 8 million people below what it had been before the pandemic. We see the same story if we look at the measure of jobs in the Bureau of Labor Statistics establishment survey. The number of jobs was down by more than 9.4 million from the pre-pandemic level.
We were also not on a clear path toward regaining these jobs rapidly. The economy actually lost 268,000 jobs in December of 2020. The average rate of job creation in the last three months of the Trump administration was just 163,000.
What the World Looked Like When Donald Trump Left Office
In the fourth quarter of 2020 the economy was still being shaped in a very big way by the pandemic. Most of the closures mandated at the start of the pandemic had been lifted, but most people were not conducting their lives as if the pandemic had gone away. We can see this very clearly in the consumption data.
Source: Bureau of Economic Analysis and author’s calculations.
The figure above shows the falloff in consumption between the fourth quarter of 2019 and the fourth quarter of 2020 in some of the areas hardest hit by the pandemic. While overall consumption was down just 0.8 percent, there has been an enormous shift from services to goods.
Inflation-adjusted spending at restaurants was down by 21.5 percent, and much of this spending went for picking up food rather than sit-down meals. Spending at bars was down 47.7 percent. Spending at hotels and motels was down by 43.8 percent as people had hugely cut back travel. Air travel was down 52.4 percent.
Spending on football games, baseball games, and sports events was down by 68.3 percent. Spending on live concerts and other entertainment was down a bit less, at 67.4 percent. And movie going was down 92.7 percent.
The Story of Cheap Gas
Donald Trump and his supporters have often boasted about the cheap gas we had when he was in office. This is true. Gas prices did fall below $2.00 a gallon in the spring of 2020 when the economy was largely shut down, although they had risen above $2.30 a gallon by the time Trump left office. The cause of low prices was hardly a secret, demand in the U.S. and around the world had collapsed. In the fourth quarter of 2020 gas consumption was still 12.5 percent below where it had been before the pandemic.
In fact, gas prices likely would have been even lower in this period if not for Trump’s actions, which he boasted about at the time. Trump claimed to have worked a deal with Russia and OPEC to slash production and keep gas prices from falling further. The sharp cutbacks in production were a major factor in the high prices when the economy began to normalize after President Biden came into office since oil production cannot be instantly restarted.
The End of the Trump Economy Was a Sad Story
Donald Trump handed President Biden an incredibly damaged economy at the start of 2021. People can rightfully say that the problems were due to the pandemic, not Trump’s mismanagement, but the impact of the pandemic did not end on January 21. The problems associated with the pandemic were the main reason the United States, like every other wealthy country, suffered a major bout of inflation in 2021 and 2022.
It is often said that people don’t care about causes, they just care about results. This is entirely plausible, but the results in the last year of the Trump administration were truly horrible by almost any measure.
It may be the case that people are more willing to forgive Trump for the damage the pandemic did to the economy than Biden, but that is not an explanation based on the reality in people’s lives, or “lived experience” to use the fashionable term.
That would mean that for some reason people recognize and forgive Trump for the difficult circumstances he faced as a result of the pandemic, but they don’t with Biden. It would be worth asking why that could be the case.
Read More Leer más Join the discussion Participa en la discusión
Back when milk prices were high, CNN found people who drank enormous amounts of milk to tell us how bad things were for people. When gas prices soared the New York Times found people who used enormous amounts of gas.
In keeping with this practice, the Washington Post found someone whose wages had more than doubled but somehow “the gains have not kept up with rising costs, and that has become a major issue for voters like him.”
According to the article the person went from working part-time at $15 an hour to working full-time at $20 an hour. If we assume that part-time work is 20 hours a week, their previous pay would have given them $15,000 a year. Their current pay at a full-time job would come to $40,000 a year. If in fact the increase in this person’s expenses offsets their pay increase they must face extraordinary expenses like a medical disaster.
The Post is trying to present this person as being typical. They are either badly confused about their expenses, or they are not typical. It would have been useful if the article had taken a few sentences to clarify this point.
Read More Leer más Join the discussion Participa en la discusión
The Biden administration has been disappointed that more people are not taking advantage of its income-driven repayment plan for student loan debt. It seems the biggest obstacle is that many borrowers simply don’t know about the plan. It turns out the people who don’t know about the plan includes people who write pieces on the burden of student debt for the New York Times.
A lengthy article on how the burden of student loan debt is leading many young people to reconsider the decision to go to college, did not once mention Biden’s income-driven repayment plan. By ignoring the existence of this plan, for which most borrowers would qualify, it hugely overstates the burden that students can expect to face.
The piece told readers that the author’s child had been mistaken in their belief that, “even with a minimum wage job, they could pay off their debt and continue to support themself with jobs that didn’t require a degree.”
In fact, under Biden’s income-driven repayment plan, a single person working at a minimum wage job would pay zero towards their student loans. For debt of less than $12,000, if they remained in the program for ten years, the debt would be forgiven. Students who borrowed larger amounts may have to wait up to twenty years for forgiveness, but the terms of the annual payments do not change.
It is worth noting that this is a program put in place by executive order. It is possible that Donald Trump would alter or eliminate it if he got a second term. Since this affects the lives of millions of people, it might be useful if the NYT could find a person who can use a government website to write about student loan debt.
Read More Leer más Join the discussion Participa en la discusión
A friend called my attention to a piece by Dan Drezner disputing the current fashion that neo-liberalism is dead. Drezner makes several good points, and gets some important things wrong, but like most “neo-liberals” and critics of neo-liberalism, he still gets the basic story wrong.
The basic point that both sides miss here is that no one was actually committed to a free market without government intervention. The difference was that the so-called neo-liberals liked to claim that their policies were about the unfettered free market, whereas their opponents liked to claim that they were attacking the free market.
In reality, the neo-liberals were simply trying to structure the market in ways that redistributed income upward, while claiming that it was all the invisible hand of the market. Their opponents bizarrely chose to attack the market instead of the way the neo-liberals were shaping it. I’ll come back to this basic issue in a moment, but first it is worth dealing with a couple of key points that Drezner gets right and then a big one he gets badly wrong.
The most important point Drezner gets right is that we can’t reverse the hit from trade to manufacturing workers, and the larger group of workers without college degrees, by adopting protectionist policies now. There is now an extensive literature showing that the opening of trade to China and other developing countries led to a loss of millions of manufacturing jobs and downward pressure on the pay of the manufacturing jobs that remain.
Since manufacturing jobs had historically been a source of relatively good-paying jobs for workers (especially male workers) without college degrees, the loss of these jobs, and the wage premium in the ones that remained, put downward pressure on the wages of non-college-educated workers more generally. The wage premium in manufacturing has largely disappeared primarily as a result of the increased openness to trade in manufactured goods.
In 1980, according to data from the Bureau of Labor Statistics, the pay for production and non-supervisory workers was nearly 6.0 percent higher for manufacturing than in the rest of the private sector. In 2023 the pay of production and non-supervisory workers in manufacturing was 9.7 percent less than in the rest of the private sector. This is not a comprehensive measure of the wage premium in manufacturing since we would also have to add in benefits and adjust for factors like age, education, and location, but there is little doubt that the wage premium has fallen sharply in the last four decades.[1]
A big part of the explanation for the decline in the premium is the plunge in unionization rates in manufacturing. In 1980, 32.3 percent of workers in manufacturing were unionized, compared to 16.5 percent in the rest of the private sector. In 2023, 7.8 percent of manufacturing workers were unionized, only slightly higher than the 5.8 percent rate for the rest of the private sector.
The plunge in unionization rates among manufacturing workers largely explains the loss in the wage premium. However, this also reinforces Drezner’s point, there is little reason to focus on bringing back manufacturing jobs in a context where there is no reason to believe they will be especially good jobs.
In fairness to the Biden administration, it has tried to couple its protectionist measures with efforts to promote unionization of the jobs that are created. But it is not clear how successful these efforts will be. And, if it can succeed in promoting unionization in manufacturing then it may also be successful in promoting unionization in sectors like healthcare and retail.
In any case, the key to creating good-paying jobs in this story is that they be union jobs. There is no magic to manufacturing. The loss of good-paying jobs in manufacturing to trade was indeed a huge hit to the working class, but simply getting back manufacturing jobs will not be a gain.
The Resilient Supply Chain Mythology
One lesson that many took from the pandemic is that we need more domestic production to ensure that our supply chains are resilient. This view involves some major confusions.
First, many of the shortages of things like face masks and other protective equipment and ventilators, that appeared at the start of the pandemic, had nothing to do with supply chains. These were stockpile problems.
We could not suddenly produce hundreds of millions of masks or tens of thousands of ventilators even if these items were all produced in Ohio. We should have had substantial stockpiles on hand for the sort of emergency that COVID created. It was a major failing of the Trump administration that we had grossly inadequate stockpiles of these items.
The second point is that having domestic suppliers doesn’t guarantee resilience. We had many factories in the United States shut down at various points because of the pandemic. If we relied exclusively on domestic production, these shutdowns would have created major problems.
The key to having resilient supply chains is having diverse sources, both domestic and international. There is a good argument for not relying on a potentially hostile country like China for a key manufacturing input like semiconductors. But apart from a relatively small number of strategically important materials and manufactured inputs, there is little reason to equate a reliance on domestic production with resiliency. There is no reason to think we somehow would have fared better in the pandemic if all our manufactured goods were produced domestically.
The Cost of Making Workers Whole: What Drezner Gets Seriously Wrong
There is an ideology among supporters of our trade policy arguing that if we had just thrown out a few dollars for additional retraining or health care then we could have ensured that everyone came out ahead. This is a story of very bad arithmetic.
The median wage has increased by around 17 percent between 1980 and 2023. If it had kept pace with productivity, as it did between 1947 and 1973, it would have roughly doubled. The difference comes to around $15 an hour or $30,000 for a full-time full-year worker. If we say we had to make 60 million workers whole, the payments would be around $180 billion a year.
Of course, there were other factors than trade depressing wages. We also had a more anti-union National Labor Relations Board. We deregulated major sectors like airlines, trucking, and telecommunications, putting downward pressure on the wages of workers in these sectors. Suppose we say that 40 percent of the lost wages, or $76 billion a year, can be blamed on trade. That is two orders of magnitude larger than the amount of assistance approved by Congress.
This sort of trade assistance is simply not a plausible story. This is not just a case of an oversight where we forgot to compensate the losers from trade, it is a fantasy to imagine that anything like the assistance needed to make the losers whole would be politically feasible. Furthermore, as an economic matter, if we have the idea that we would raise this sort of money through taxes, the distortionary impact of these taxes would offset many of the gains from more open trade.
In short, making losers whole was not a serious possibility. The point of the trade policy pursued by the country over the last forty years was to redistribute income from the bottom half of the wage distribution to those in the top 10 or 20 percent. That is the result predicted by economic theory and that was the reality.
Neo-Liberalism is a Lie
The biggest problem in the debate over the demise of neo-liberalism is that it accepts a view that is obviously at odds with reality. Neo-liberalism was never about just leaving things to the market. That is an absurd proposition on its face. There is no market out there to leave things to, markets must be structured by policy. The debates over the last four decades were about how to structure markets, not whether to just leave things to the market.
Starting with trade, there was no big effort from so-called neo-liberals to open up trade in physicians’ services or the services of other highly paid professionals. This is not because increased trade in these services, by travel of physicians or patients or telemedicine is not possible, it is because these professionals have a lot of political power and could keep any discussion of lessening of the barriers that protect them off the political agenda. As a result, our doctors get paid twice as much as doctors in other wealthy countries. (Our manufacturing workers get paid considerably less.)
There is nothing about the market that tells us to subject manufacturing workers to competition with low-paid workers in the developing world and to protect the most highly paid professionals from the same sort of competition. That was a conscious policy with the predictable effect of increasing inequality.
Government-Granted Patent and Copyright Monopolies Are Not Given to Us by the Free Market
An even bigger area that the critics of imaginary neo-liberalism like to overlook is patent and copyright policy. We redistribute over $1 trillion annually in rents, close to half of after-tax corporate profits, due to these government-granted monopolies. In drugs alone the amount likely comes to over $500 billion annually, as we will spend over $600 billion this year for drugs that would likely sell for less than $100 billion in a free market without patent monopolies or related protections.
These government-granted monopolies also account for the bulk of the price in a number of other areas, including computers, software, smartphones, medical equipment, and of course video games and movies. It is almost Trumpian that anyone can look at an economy where government-granted monopolies play such a massive role in distribution and then pronounce it to be a free market without government intervention. It is even more absurd when we consider that the government plays a large role in creating the intellectual products subject to these monopolies, most notably with prescription drugs where it spends over $50 billion a year on biomedical research.
The Rules of Corporate Governance Are Not Given to Us by the Free Market
Corporate governance is another enormously important area where the critics of neo-liberalism apparently believe that detailed rules get written by the free market. It is common for people on the left to criticize the practice of share buybacks, at least in part on the basis that they allow top management to manipulate the market to maximize the value of their stock options.
If that claim is accurate, it effectively means that top corporate management is getting high pay by ripping off the companies they work for. After all, if the shareholders wanted CEOs and other top management to get higher pay, they could just give it to them.
The implication is that if shareholders had more control over the companies that they ostensibly own, CEOs would get lower pay. The current pattern persists because CEOs and top management largely control who gets on and stays on the corporate boards that determine their pay.
This is not just an issue of the pay of a small number of executives at the top of 500 or 1,000 major companies, the pay of top executives sets pay patterns throughout the economy. We would be in a very different world if CEO pay had roughly the same ratio to the pay of ordinary workers as it did fifty years ago. In that case, CEOs would be getting around $3 million a year rather than $30 million a year. And this change would have absolutely zero to do with a free market or government intervention, it is about writing different rules of corporate governance.
Financial Industry Bailouts Are Not Given to Us by the Free Market
In 2008, when the collapse of the housing bubble was sending shock waves through the financial system, the high priests of “neo-liberalism” ran to Congress and demanded a massive bailout to prevent a Second Great Depression. The risk of a Second Great Depression was of course a lie (we know the secret for getting out of a depression, it’s called “spending money”), but the point was that they were not yelling that we need to leave things to the market.
It’s not just the occasional bailout that pulls the government into the financial sector, the entire structure of the industry depends in very fundamental ways on the government, most obviously with deposit insurance and the Fed’s lending windows. Here too the interventions matter in a big way for inequality since many of the biggest fortunes in the country were made in the financial industry.
We could shape the industry in ways that make it less conducive to accumulating vast fortunes. For example, nothing about the free market says that we need to have special tax treatment, in the form of the carried interest tax deduction, for private equity and hedge fund partners, some of the richest people in the country. We also could look to ensure that the bankruptcy laws, often used by private equity funds in the firms they take over, are not a tool to rip off workers, suppliers, and other creditors.
And we could try to minimize the need for the financial sector by having the government perform tasks where a centralized entity is most efficient, like Social Security or health insurance. It is a simple truth of economics that an efficient financial sector is a small financial sector. Finance is an intermediate good like trucking. It is essential for the economy, but it does not provide a direct benefit to households like the healthcare or housing sectors. Believers in the free market should want to see the financial sector downsized, not the bloated financial sector we have today.
Section 230 Was Not Given to Us by the Free Market
Many progressives (and non-progressives) have complained about the power of huge social media platforms like Facebook, Twitter (now “X”), and TikTok. These platforms reach an order of magnitude more people than even the largest television stations or newspapers. Their moderation decisions are entirely at the whim of their owners, who also happen to be very rich.
The astounding growth of these platforms was not just the natural working of the market, although the network effects associated with online platforms are important. A major factor allowing for the growth of these platforms was the decision by Congress to exempt them from the same sort of liability for spreading defamatory material that print or broadcast outlets face.
If a television station or newspaper spread defamatory material statements, they would face legal liability, even if they did not originate them. This in fact was largely the story with Dominion’s suit against Fox. Much of the material cited in the suit was not from people paid by the network, but rather statements from guests on its news shows.
But Section 230 of the 1996 Communications Decency Act protects Internet platforms from liability for third-party content. This means that Mark Zuckerberg and Elon Musk can profit from spreading lies that would cost the New York Times or CNN millions in defamation suits.
It is often argued that it would be impossible for Internet platforms to screen the hundreds of millions of items posted every day. That is true, but they could face a takedown requirement after notification. They have managed to survive just fine with this sort of requirement with reference to copyright violations for a quarter century since the passage of the Millennial Copyright Act.
We can also structure a repeal in a way that is likely to favor smaller platforms, for example by allowing platforms that don’t sell ads or personal information to continue to enjoy Section 230 protection. In any case, it should be pretty obvious that Section 230 protection is not the free market. It was a decision by Congress to benefit Internet platforms relative to print and broadcast outlets. And it hugely facilitated the growth of giant Internet platforms.
The Death of Neo-Liberalism: Victory Over a Non-Existent Enemy
Like everyone else, I love a victory party, but it’s hard to get too excited over defeating an enemy that does not exist. The Biden administration has adopted many progressive economic policies. Its ambitious recovery package quickly got the economy back to full employment, which also led to large wage gains for the lowest-paid workers.
It has also pushed forward with a major infrastructure program, and the Inflation Reduction Act is by far the most aggressive climate legislation ever passed in the U.S. It also has taken steps to rein in patent monopoly pricing for prescription drugs. And for the first time in decades, we have an administration that takes anti-trust policy seriously. In addition, it has made the terms for buying into the exchanges created by the Affordable Care Act far more generous, and crafted an income-driven student loan repayment plan that should mean that this debt is not a major burden.
All of these are positive developments, which can be built upon in a second Biden administration. But they have nothing to do with defeating neo-liberalism.
If we want to make serious progress in advancing progressive economic policies, we need to have a clear idea of what we are fighting. The idea that we were fighting against the free market is absurd on its face.
The market is a tool, like the wheel. It would be as absurd to have a fight against the market as a fight against the wheel. The problem is not the market, but rather a set of policies that the right has used to structure the market to redistribute income upward. We need to attack those policies, not celebrate a victory over an imaginary foe. (Yes, I am talking my book, Rigged [it’s free].)
[1] Larry Mishel has a fuller analysis which also shows a sharp decline, but still finds a substantial wage premium, although the analysis ends with the period 2010-2016, missing any declines in the subsequent seven years.
Read More Leer más Join the discussion Participa en la discusión
I have a lot of respect for Ro Khanna. He is an articulate and energetic progressive from the belly of the beast, Silicon Valley. I also appreciate the sentiments behind his latest op-ed in the NYT on how we should seek to ensure that the benefits from AI are broadly shared. However, he badly errors in his framing of the issue and description of recent economic policy.
Khanna describes our policy on trade in the 1990s:
“Today the Democratic Party is at a crossroads, as it was in the 1990s, when the dominant wing in the party argued for prioritizing private-sector growth and letting the chips fall where they may. The criticism of this approach offered around that time by Senator Paul Wellstone, Senator Russ Feingold and Representative Bernie Sanders (as he was then) — that the offshoring globalization debacle was not helping the working class and was, in fact, hurting it — was largely ignored.”
It is wrong to say that our trade policy was “letting the chips fall where they may.” It was in fact far worse.
The policy was to deliberately subject manufacturing workers to competition with the low paid workers in the developing world. This had the predicted and actual effect of eliminating millions of manufacturing jobs and lowering the wages of manufacturing workers in the jobs that remained. Furthermore, since manufacturing had historically been a source of high-paid employment for workers without college degrees, this put downward pressure on the pay of less-educated workers more generally.
At the same time that we were using trade policy to depress the wages of less-educated workers, we continued to leave protections in place for more highly educated workers like doctors and dentists. We also increased protections in the form of patent and copyright monopolies, which we made stronger and longer both in domestic policy and internationally through trade agreements. This raised the profits and the wages of those in a position to benefit from these monopolies.
It is a gross misrepresentation to say that the government policy in this period was just leaving things to the market, it was a deliberate policy of upward redistribution. It is also important to recognize that most of the upward redistribution was within the wage distribution, not to profits. The profit share of national income changed little from 1980 to 2000, at which point most of the upward redistribution had already taken place.
The big gainers from the upward redistribution were high-end professionals, well-placed STEM workers, Wall Street types, and high-level corporate executives. We need to recognize this fact if we want to structure the benefits from AI in ways that lead to broadly based gains.
AI does offer enormous potential in this way. For example, AI could allow a trained healthcare professional, like a nurse practitioner or a physician’s assistant, to make diagnoses as well or better than doctors. AI could also replace many of the higher paid workers in various STEM professions, like drug development. If we don’t allow research findings to be bottled up with government-granted patent rights or other protections, AI could benefit the bulk of the population by giving us lower cost health care and legal services, in addition to savings in many other areas.
The key point here is to recognize that policy has always consciously directed trade and technology. It is to the benefit of the winners to pretend that the upward redistribution of the last four decades was “letting the chips fall where they may,” but that is not the reality. And, they won’t let you say that in the New York Times.
Read More Leer más Join the discussion Participa en la discusión
In the NYT’s Morning Newsletter, German Lopez told readers that “the debt matters again.” The story is that the economy has changed so now we have to get seriously worried about the size of the government debt. He gives us three reasons:
While these claims have some basis in reality, they don’t make the case for the immediate action he urges in the piece.
On the first point, higher interest rates do mean higher interest payments, but the rise is not as sharp as he claims and even with higher rates we are still looking at much lower interest rates than we saw in the late 1990s, when the government was running budget surpluses.
The current real interest rate is around 1.7 percent. That is about a percentage point higher than it was in the years just before the pandemic, but almost two percentage points below where it was in the late 1990s. This hardly seems like a cause for great concern.
The second and third points should really be taken together. The point is that the economy is now operating near its capacity, it does not need the boost from large deficits to sustain high levels of employment, and in fact, this boost may now spur inflation.
While the first part is true, it is not clear how much we could reduce the deficit without seeing an impact on employment and output. For example, if we had a $270 billion dollar annual increase in taxes (or cut in spending), approximately 1.0 percent of GDP, it is likely that it would substantially slow growth and lead to some increase in unemployment.
As we saw with the Fed’s recent rate hikes, the economy is far less sensitive to interest rates than many of us had believed. This means that even if the Fed responded to the prospect of smaller deficits by aggressively lowering rates, it may not be able to offset the hit to demand. We may still see the economy slow and unemployment rise.
This brings us to the inflation side of the equation. The most recent inflation reports indicate that inflation is coming down to a pace consistent with the Fed’s 2.0 percent target. This means that current levels of deficit spending are not leading to inflation. Therefore, there should be little urgency in reducing them.
What About Implicit Debt Created by Government-Granted Patent and Copyright Monopolies?
In keeping with its quasi-religious commitment to ignore the implicit debt created by government-granted patent and copyright monopolies, Lopez makes no mention of them in this piece. The point here is straightforward. The government can pay for innovation and creative work through direct spending, as it already does to a substantial extent, for example, by spending over $50 billion a year on biomedical research through the National Institutes of Health.
Alternatively, it can pay for innovation and creative work by granting patent and copyright monopolies, threatening to arrest people who sell items that compete with new innovations or creative work. I previously compared granting patent and copyright monopolies to the practice of tax farming, selling off the right to collect taxes, which was a common practice in pre-revolutionary France and elsewhere.
The German Lopezes of the world, who yell about the debt, would presumably be fine with tax farming, since it doesn’t increase the debt by a dime. In fact, it reduces the debt, since the payments the government collects for selling off the right to collect future taxes means lower deficits, and therefore a lower debt.
In the same vein, these people insist on ignoring the implications of granting patent and copyright monopolies, which likely now lead to patent rents in excess of $1 trillion a year. In fact, since the government pays part of these rents, most notably with prescription drugs through Medicare, Medicaid, and other government programs, the parceling out of these monopolies directly raises the government debt.
Nonetheless, the deficit hawks somehow can’t see them. This is hard to understand since they are not obviously stupid people. Perhaps it is because they like the people who receive these rents, people like Bill Gates and the folks who own and work at the drug companies, more than they like the people who benefit from most government spending. But that would just be speculation.
Anyhow, if we want to have a serious discussion of the impact of the government debt on the economy it has to include a discussion of the impact of government-granted patent and copyright monopolies. Otherwise, it is just about pushing an agenda.
Read More Leer más Join the discussion Participa en la discusión