January 24, 2014
In July, economists Jonathan Meer and Jeremy West made a splash with a new paper arguing that even though the minimum wage doesn’t appear to have much effect on the level of employment (a position that should make more traditional critics of the minimum wage feel uncomfortable), a higher minimum wage does lower future growth in employment.
A few months later, economist Arindrajit Dube wrote a detailed, technical critique of Meer and West’s paper. Dube raised a number of issues, but his main point was that Meer and West’s statistical techniques show effects of the minimum wage in sectors where we would least expect to find them, such as manufacturing (where few workers earn close to the minimum wage), and no effect in sectors, such as as retail and food services, where the minimum wage plays a much bigger role in setting wages.
In December, Meer and West issued a new version of their paper and a separate appendix responding to Dube and directly addressing his argument that they find effects in all the wrong places. Meer and West use data from the Quarterly Census of Employment and Wages (QCEW) and the Quarterly Workforce Indicators (QWI) datasets (in the July version of the paper, they had only used data from Business Dynamics Statistics (BDS), which doesn’t have industry breakdowns) to estimate separate effects of the minimum wage across a full range of industries.
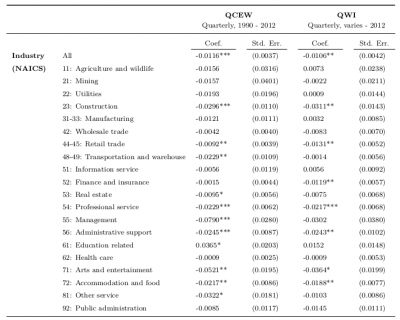
Here is the complete set of their industry-level results:
In Meer and West’s view, the results are close to what they’d expect: “…industries that tend to have a higher concentration of low-wage jobs show more deleterious effects on job growth from higher minimum wages, and the results appear consistent between the QCEW and QWI.” (p. 25)
But, this reading of the results glosses over many contradictions and inconsistencies. To highlight a few:
First, as Meer and West comment themselves in a footnote: “It may seem anomalous that professional services would be negatively affected.” They downplay this result by noting that: “…firms in this category span a broad array, from lawyers’ offices to direct mail advertising” (p. 25), but don’t provide any wage data on the industry.
Second, using the QCEW data, the biggest negative employment effects –more than three times bigger than in “accommodation and food” and more than eight times bigger than in “retail trade”– were in “management” services. They dismiss this result in a footnote: “The large negative effect on … “management” … is perhaps stranger; note, though, that the effect is only present in the QCEW and that this category has among the fewest firms of any industry.” (p. 25)
Third, construction, which shows negative employment effects in both data sets is not, contrary to Meer and West’s apparent assumption, a particularly low-wage sector, which makes it a poor test of minimum-wage effects. (In fact, as I’ll show below, construction has roughly the same average weekly wage and roughly the same share of low-wage workers as manufacturing, the sector that Dube focused on in his critique of the original Meer and West paper.)
What is curious about Meer and West’s discussion of these results is that it is actually fairly easy to get an idea of the wage structure in these industries. There is no need to speak in generalities.
Below, I have plotted the two sets of the industry-specific employment responses from Meer and West’s table –one set based on the QCEW, the other, on the QWI– against two separate indicators of industry wage structure.
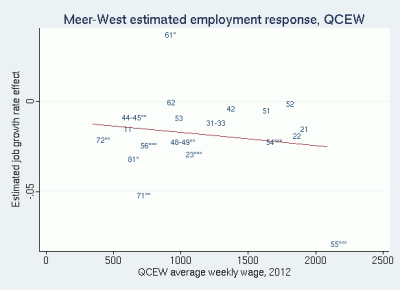
The first chart shows the results from plotting the estimated QCEW employment responses against the average weekly wage, for each industry in 2012, which I downloaded from the QCEW web page.:
If the minimum wage is driving employment responses across industries, we’d expect that industries that pay the lowest wages would show the biggest response to minimum-wage increases. Instead, the employment response appears to be unrelated to the average industry wage. If anything, a regression line fitted to the data slopes down, implying that the minimum wage has the largest effect on employment in high-paying industries (though the relationship is not remotely statistically significant).
Note that the point in the lower right-hand corner labeled 55*** is “management services,” which clearly has the highest average wages and, oddly, the biggest employment losses in response to the minimum wage. (The *** indicates that the underlying estimate is statistically significant at the one-percent level; elsewhere, ** indicates statistical significance at the five-percent level; *, at the ten-percent level.) The point labeled 23***, near the center of the chart (just below the fitted line), is construction, which is nearer to the middle than the bottom of the wage distribution.
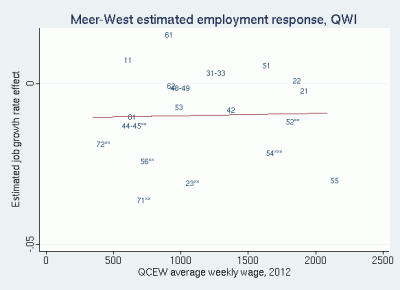
The same exercise with the QWI employment estimates gives an almost identical result:
Once again, contrary to what we’d expect if the minimum wage were behind slower employment growth, the results show no relationship at all between average industry wages and the estimated industry employment effect.
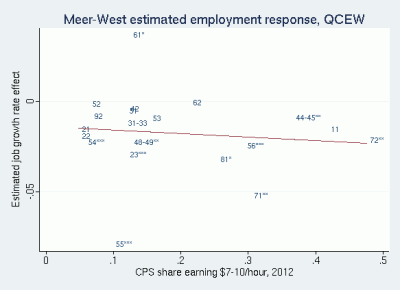
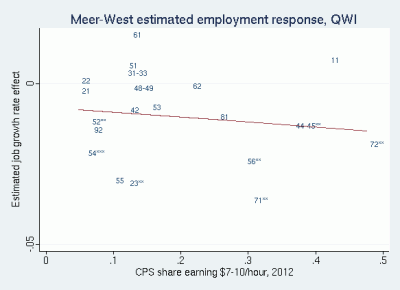
The average wage in an industry, though, might not reflect accurately what is happening for workers at the bottom. So, I repeated the preceding two charts using the share of low-wage workers in each industry. Here, I used the Current Population Survey (CPS) to estimate the share of workers in each industry that earned between $7.00 and $10.00 per hour in 2012. (The lower limit of $7.00 is just below the federal minimum wage of $7.25 –to catch anyone that might round the hourly wage they report down to $7.00 from $7.25; and, $10.00 is at the upper end of the highest state minimum wages in place in that year.)
Using the QCEW estimated employment effects with this second wage variable:
And now with the QWI estimated employment effects:
Again, in both cases, the industry employment effects appear to be completely unrelated to industry wage levels, making it hard to believe that changes in wages driven by the minimum wage are causing the observed changes in industry employment.
These four scatter plots are suggestive, but what would be better would be for Meer and West to apply their statistical approach to the industrywage variables (not just the industry employment variables) available in their data sets. If the minimum wage is not raising wages in an industry, then the minimum wage can’t reasonably be blamed for slowing job growth in that industry either.
More importantly, if the minimum wage appears to be slowing employment growth in an industry –even though it isn’t boosting wages in that industry– then this raises serious questions about the statistical methods being used to link any employment slowdown to the minimum wage.
In the meantime, the evidence in the charts above supports Dube’s view that something other than the minimum wage is driving Meer and West’s findings.
This post originally appeared on John Schmitt’s blog, No Apparent Motive. January 24, 2014


