

April 14, 2011

Last month, the real of the dollar against other currencies hit a new record low. Aside from a brief spike in late 2008 — the result of a crisis-induced “flight to safety” — the dollar has undergone a steady decline since early 2002. Over the last nine years, the dollar has fallen 27 percent relative to those of major trading partners.
What happens to the economy as the dollar falls? At first, U.S. importers of (say) British goods trade more dollars to get the pounds they need to purchase British goods. This means that the cost of imports measured in dollars rises, increasing the size of the trade deficit (imports minus exports). Similarly, British importers of American goods find they require fewer pounds to get the dollars they need to buy American goods.
Over time, Americans notice that British goods have become more expensive in comparison to domestically produced goods. In other words, the price of U.S.-made sweaters becomes cheaper relative to the price of sweaters imported from Britain. This will lead us to buy fewer sweaters from Britain and more domestically manufactured sweaters.
At the same time, the British notice that American goods have become relatively inexpensive in comparison to goods made at home. This means it takes fewer pounds to buy a sweater made in the United States, so the British will buy more sweaters made in the United States and fewer of their domestically manufactured sweaters.
While American producers notice the increased demand for their exports, allowing them to raise their prices somewhat and still sell more than they had before the dollar fell. Similarly, for British exporters to continue selling they must lower prices.
Thus, as everyone eventually adjusts to the fall in the dollar, the trade deficit shrinks.
This is not new economics by any stretch. Back in 1983, the trade deficit amounted to 10 percent of total trade in and out of the United States — not so different from today.[1] But only three years prior, the United States had briefly run a trade surplus. Senator Lawton Chiles asked the Congressional Budget Office to “identify the sources of the decline in U.S. trade performance and to estimate the shares of the deterioration originating in each source.” The CBO reported back in 1984 that somewhere between 90 and 125 percent of the observed increase in the trade deficit was attributable to dollar appreciation. (The rise in the dollar was able to account for more than all of the increase as the deep recession was found to decrease the trade deficit by one-quarter to one-third as much. In a recession, consumers buy less of everything, including imports.)
The dollar — already up 28 percent over the time period CBO examined — continued to rise from a low of 88 in 1978 up 44 percent to its 1985 peak of 127, as we see in the light blue line of Figure 1.
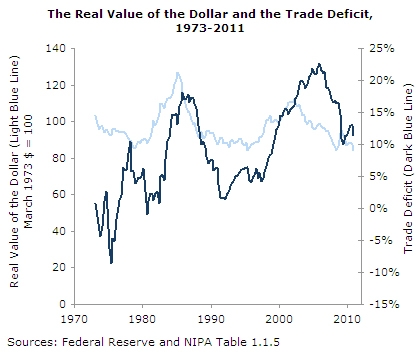
Sources: Federal Reserve and NIPA Table 1.1.5
As the dark blue line of Figure 1 shows, the deficit would continue to grow to nearly 18 percent of total trade [2] — a gap of more than three percent of GDP.
As the dollar fell from its 1985 peak, so the trade deficit did follow. By the early 1990s, the trade deficit had shrunk to less than 1.5 percent of trade — a mere 0.3 percent of GDP. The dollar had fallen all the way back to its mid-1980 low.
Over the next 10 years, the dollar regained value — 27 percent by the start of 2002 — and the trade deficit grew to 20 percent of trade in 2003. By the end of 2005, Americans were spending $1.58 on imports for every $1.00 earned from exports. Because trade had become a larger share of the economy, the deficit surpassed 6 percent of GDP.
In the early 1980s, the recession partially countered the deficit-expanding effect of the dollar’s rapid appreciation. By contrast, the 2008 recession came as the dollar fell, making for a sharp rebalancing of trade. From nearly 23 percent of total trade at the end of 2005, to down under 11.5 percent, the trade deficit sat at a little over 3 percent of GDP at the end of last year.
It’s rather clear that though buyers and sellers may take time to adjust, prices — exchange rates — do matter. Even if the dollar falls no further, it is likely that trade will continue to balance. U.S. exports will grow faster than imports, and American manufacturing will expand. Significantly, at a time when deficits are the talk of the town in the nation’s capitol, falling trade deficits will imply some combination of lower government deficits and greater private savings — welcome news to those who fret over America’s financial future.
[1] Bureau of Economic Analysis, National Income and Product Accounts Table 1.1.5, Lines 15 and 18. http://bea.gov/national/nipaweb/TableView.asp?SelectedTable=5&FirstYear=2009&LastYear=2010&Freq=Qtr

